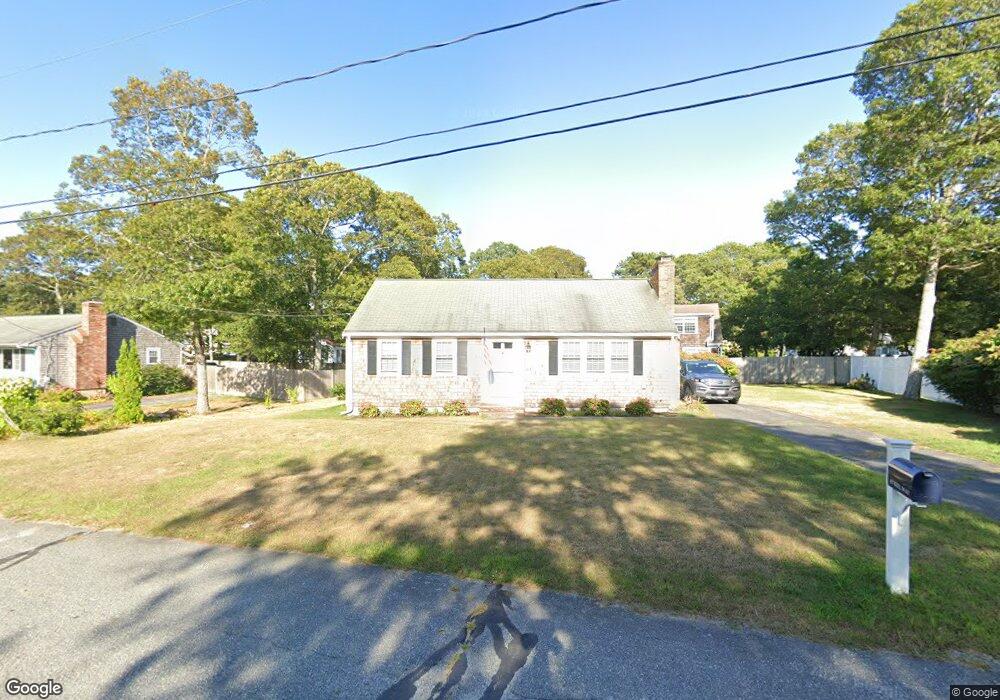
42 Keel Way Hyannis, MA 02601
Estimated Value: $482,000 - $567,000
2
Beds
1
Bath
988
Sq Ft
$536/Sq Ft
Est. Value
About This Home
This home is located at 42 Keel Way, Hyannis, MA 02601 and is currently estimated at $529,966, approximately $536 per square foot. 42 Keel Way is a home located in Barnstable County with nearby schools including Hyannis West Elementary School, Barnstable United Elementary School, and Barnstable Intermediate School.
Ownership History
Date
Name
Owned For
Owner Type
Purchase Details
Closed on
Feb 19, 2020
Sold by
Prior Janet M and Prior Lorraine A
Bought by
Prior Janet M
Current Estimated Value
Purchase Details
Closed on
Aug 14, 1987
Sold by
Hammerman Miriam
Bought by
Prior Janet M
Home Financials for this Owner
Home Financials are based on the most recent Mortgage that was taken out on this home.
Original Mortgage
$101,900
Interest Rate
10.4%
Mortgage Type
Purchase Money Mortgage
Create a Home Valuation Report for This Property
The Home Valuation Report is an in-depth analysis detailing your home's value as well as a comparison with similar homes in the area
Home Values in the Area
Average Home Value in this Area
Purchase History
| Date | Buyer | Sale Price | Title Company |
|---|---|---|---|
| Prior Janet M | -- | None Available | |
| Prior Janet M | $127,400 | -- |
Source: Public Records
Mortgage History
| Date | Status | Borrower | Loan Amount |
|---|---|---|---|
| Previous Owner | Prior Janet M | $57,152 | |
| Previous Owner | Prior Janet M | $101,900 |
Source: Public Records
Tax History Compared to Growth
Tax History
| Year | Tax Paid | Tax Assessment Tax Assessment Total Assessment is a certain percentage of the fair market value that is determined by local assessors to be the total taxable value of land and additions on the property. | Land | Improvement |
|---|---|---|---|---|
| 2025 | $3,675 | $396,400 | $146,700 | $249,700 |
| 2024 | $3,568 | $394,200 | $146,700 | $247,500 |
| 2023 | $3,312 | $346,100 | $133,300 | $212,800 |
| 2022 | $3,293 | $284,600 | $98,800 | $185,800 |
| 2021 | $2,994 | $251,400 | $98,800 | $152,600 |
| 2020 | $3,111 | $252,300 | $98,800 | $153,500 |
| 2019 | $2,934 | $233,200 | $98,800 | $134,400 |
| 2018 | $2,667 | $216,800 | $104,000 | $112,800 |
| 2017 | $2,490 | $207,700 | $104,000 | $103,700 |
| 2016 | $2,457 | $209,500 | $105,800 | $103,700 |
| 2015 | $2,331 | $201,500 | $100,900 | $100,600 |
Source: Public Records
Map
Nearby Homes