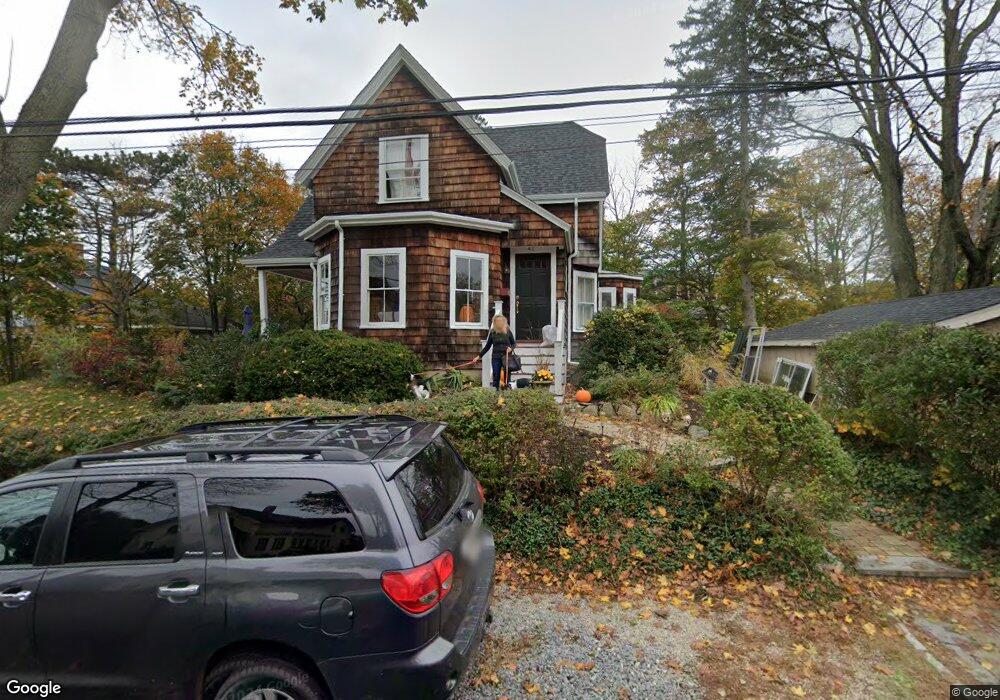
42 Lafayette Ave Hingham, MA 02043
Estimated Value: $1,037,000 - $1,389,000
3
Beds
2
Baths
1,892
Sq Ft
$628/Sq Ft
Est. Value
About This Home
This home is located at 42 Lafayette Ave, Hingham, MA 02043 and is currently estimated at $1,188,207, approximately $628 per square foot. 42 Lafayette Ave is a home located in Plymouth County with nearby schools including William L. Foster Elementary School, Hingham Middle School, and Hingham High School.
Ownership History
Date
Name
Owned For
Owner Type
Purchase Details
Closed on
Sep 30, 2025
Sold by
Hill Gerard F
Bought by
Hill Gerard F and Hill Suzanne M
Current Estimated Value
Purchase Details
Closed on
Aug 14, 1992
Sold by
Roath Steven J and Roath Lauren G
Bought by
Hill Gerard F and Hill Suzanne M
Purchase Details
Closed on
Oct 14, 1987
Sold by
Brassard Roland R
Bought by
Roath Steven J
Create a Home Valuation Report for This Property
The Home Valuation Report is an in-depth analysis detailing your home's value as well as a comparison with similar homes in the area
Purchase History
| Date | Buyer | Sale Price | Title Company |
|---|---|---|---|
| Hill Gerard F | -- | -- | |
| Hill Gerard F | $221,000 | -- | |
| Roath Steven J | $217,900 | -- |
Source: Public Records
Mortgage History
| Date | Status | Borrower | Loan Amount |
|---|---|---|---|
| Previous Owner | Roath Steven J | $222,000 | |
| Previous Owner | Roath Steven J | $50,000 | |
| Previous Owner | Roath Steven J | $240,000 |
Source: Public Records
Tax History
| Year | Tax Paid | Tax Assessment Tax Assessment Total Assessment is a certain percentage of the fair market value that is determined by local assessors to be the total taxable value of land and additions on the property. | Land | Improvement |
|---|---|---|---|---|
| 2025 | $9,093 | $850,600 | $456,100 | $394,500 |
| 2024 | $8,334 | $768,100 | $456,100 | $312,000 |
| 2023 | $7,531 | $753,100 | $456,100 | $297,000 |
| 2022 | $7,801 | $674,800 | $380,100 | $294,700 |
| 2021 | $7,546 | $639,500 | $380,100 | $259,400 |
| 2020 | $7,373 | $639,500 | $380,100 | $259,400 |
| 2019 | $7,354 | $622,700 | $380,100 | $242,600 |
| 2018 | $16,519 | $613,400 | $380,100 | $233,300 |
| 2017 | $6,925 | $565,300 | $364,000 | $201,300 |
| 2016 | $6,801 | $544,500 | $346,700 | $197,800 |
| 2015 | $6,387 | $509,700 | $330,200 | $179,500 |
Source: Public Records
Map
Nearby Homes
Your Personal Tour Guide
Ask me questions while you tour the home.