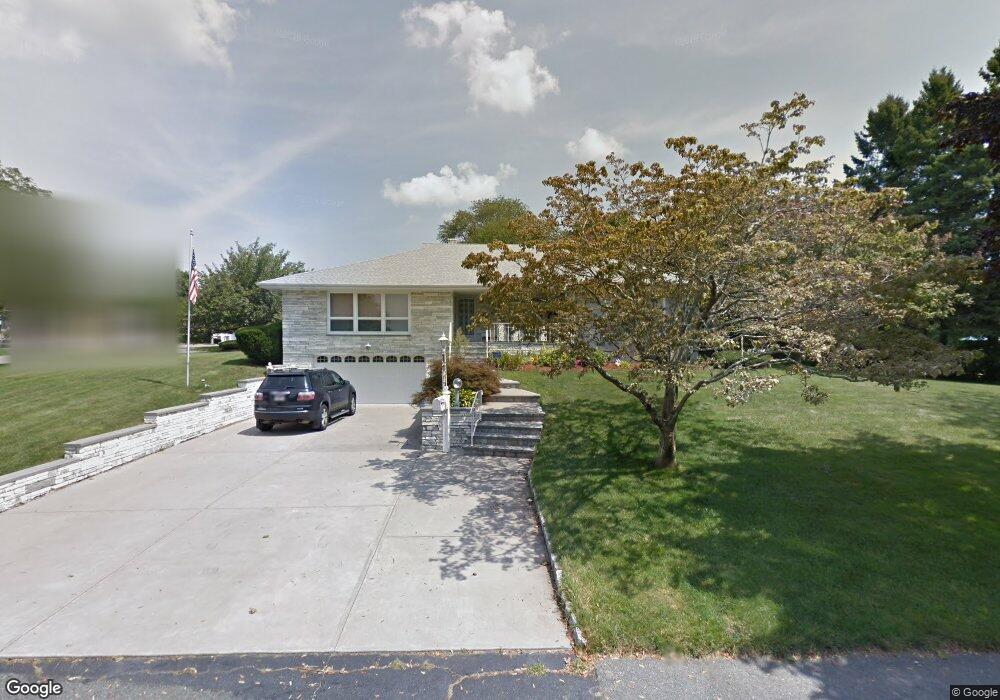
42 Lancaster St New Bedford, MA 02746
Riverside Park NeighborhoodEstimated Value: $495,000 - $577,000
3
Beds
3
Baths
2,242
Sq Ft
$245/Sq Ft
Est. Value
About This Home
This home is located at 42 Lancaster St, New Bedford, MA 02746 and is currently estimated at $550,066, approximately $245 per square foot. 42 Lancaster St is a home located in Bristol County with nearby schools including Carlos Pacheco Elementary School, Keith Middle School, and New Bedford High School.
Ownership History
Date
Name
Owned For
Owner Type
Purchase Details
Closed on
May 21, 2001
Sold by
Rodrigues Helen F
Bought by
Barros Manuel Pina and Barros Amelia L
Current Estimated Value
Purchase Details
Closed on
May 18, 2001
Sold by
Rodrigues Helena F
Bought by
Higham Kevin and Higham Kathleen
Purchase Details
Closed on
Mar 4, 1997
Sold by
Remillard Raymond B and Remillard Alma
Bought by
Rodrigues Helena F
Create a Home Valuation Report for This Property
The Home Valuation Report is an in-depth analysis detailing your home's value as well as a comparison with similar homes in the area
Home Values in the Area
Average Home Value in this Area
Purchase History
| Date | Buyer | Sale Price | Title Company |
|---|---|---|---|
| Barros Manuel Pina | $195,000 | -- | |
| Barros Manuel Pina | $195,000 | -- | |
| Higham Kevin | $10,000 | -- | |
| Rodrigues Helena F | $172,000 | -- | |
| Rodrigues Helena F | $172,000 | -- |
Source: Public Records
Mortgage History
| Date | Status | Borrower | Loan Amount |
|---|---|---|---|
| Open | Rodrigues Helena F | $152,300 | |
| Closed | Rodrigues Helena F | $167,650 | |
| Closed | Rodrigues Helena F | $183,000 |
Source: Public Records
Tax History Compared to Growth
Tax History
| Year | Tax Paid | Tax Assessment Tax Assessment Total Assessment is a certain percentage of the fair market value that is determined by local assessors to be the total taxable value of land and additions on the property. | Land | Improvement |
|---|---|---|---|---|
| 2025 | $6,353 | $561,700 | $193,900 | $367,800 |
| 2024 | $6,698 | $558,200 | $196,600 | $361,600 |
| 2023 | $6,209 | $434,500 | $144,400 | $290,100 |
| 2022 | $5,899 | $379,600 | $138,400 | $241,200 |
| 2021 | $5,684 | $364,600 | $132,400 | $232,200 |
| 2020 | $5,776 | $357,400 | $132,400 | $225,000 |
| 2019 | $5,578 | $338,700 | $132,400 | $206,300 |
| 2018 | $5,185 | $311,800 | $132,400 | $179,400 |
| 2017 | $4,875 | $292,100 | $126,300 | $165,800 |
| 2016 | $4,520 | $274,100 | $120,300 | $153,800 |
| 2015 | $4,257 | $270,600 | $120,300 | $150,300 |
| 2014 | $4,164 | $274,700 | $123,300 | $151,400 |
Source: Public Records
Map
Nearby Homes