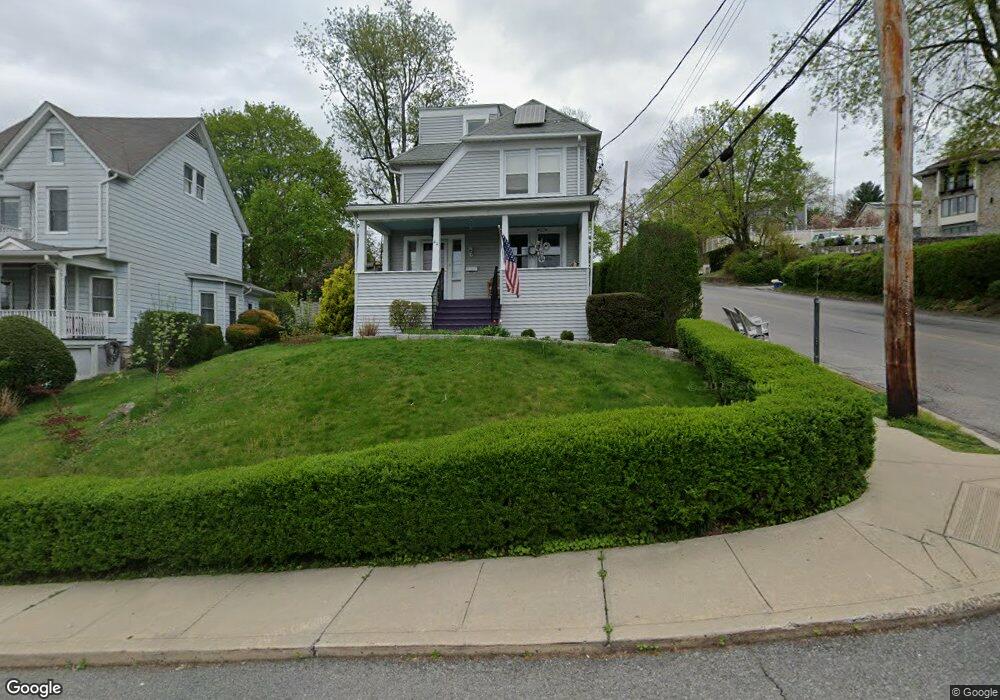
42 Linden Ave Ossining, NY 10562
Estimated Value: $523,000 - $628,000
3
Beds
2
Baths
1,372
Sq Ft
$414/Sq Ft
Est. Value
About This Home
This home is located at 42 Linden Ave, Ossining, NY 10562 and is currently estimated at $567,492, approximately $413 per square foot. 42 Linden Ave is a home located in Westchester County with nearby schools including Park School, Roosevelt Elementary School, and Claremont School.
Ownership History
Date
Name
Owned For
Owner Type
Purchase Details
Closed on
Oct 11, 2001
Sold by
Nowakowski Frances A
Bought by
Starace Christopher and Viggiano Cara
Current Estimated Value
Create a Home Valuation Report for This Property
The Home Valuation Report is an in-depth analysis detailing your home's value as well as a comparison with similar homes in the area
Home Values in the Area
Average Home Value in this Area
Purchase History
| Date | Buyer | Sale Price | Title Company |
|---|---|---|---|
| Starace Christopher | $260,000 | The Judicial Title Ins Agenc |
Source: Public Records
Tax History
| Year | Tax Paid | Tax Assessment Tax Assessment Total Assessment is a certain percentage of the fair market value that is determined by local assessors to be the total taxable value of land and additions on the property. | Land | Improvement |
|---|---|---|---|---|
| 2024 | $14,125 | $491,900 | $147,900 | $344,000 |
| 2023 | $13,500 | $460,100 | $147,900 | $312,200 |
| 2022 | $12,984 | $419,000 | $147,900 | $271,100 |
| 2021 | $10,621 | $370,300 | $147,900 | $222,400 |
| 2020 | $10,351 | $355,400 | $147,900 | $207,500 |
| 2019 | $10,194 | $293,700 | $147,900 | $145,800 |
| 2018 | $10,118 | $293,700 | $147,900 | $145,800 |
| 2017 | $1,545 | $290,800 | $147,900 | $142,900 |
| 2016 | $95,645 | $285,100 | $147,900 | $137,200 |
| 2015 | $6,451 | $16,720 | $4,100 | $12,620 |
| 2014 | $6,451 | $16,720 | $4,100 | $12,620 |
| 2013 | $6,451 | $16,720 | $4,100 | $12,620 |
Source: Public Records
Map
Nearby Homes
- 132 Croton Ave
- 59 Watson Ave
- 8 Eldridge Ave
- 15 Ferris Place
- 38 Terrace Ave
- 1 Noel Dr
- 90 Broadway
- 135 N Highland Ave
- 39 Ann St
- 143 N Highland Ave
- 16 Maple Place
- 135 Main St Unit 203
- 0 van Wyck St Unit KEY834077
- 26-28 Lincoln Place
- 7 Hawkes Ave
- 40 Broadway
- 1 Edward St
- 5-7 Hill St
- 42 Campwoods Grounds
- 2 N Water St Unit 1A
- 44 Linden Ave
- 31 Clinton Ave
- 46 Linden Ave
- 40 Linden Ave
- 40 Linden Ave Unit 2
- 33 Clinton Ave
- 27 Clinton Ave
- 48 Linden Ave
- 25 Clinton Ave
- 35 Clinton Ave
- 43 Linden Ave Unit 1L
- 43 Linden Ave
- 23 Clinton Ave
- 50 Linden Ave
- 38 Linden Ave
- 41 Linden Ave
- 47 Linden Ave
- 41 Clinton Ave
- 21 Clinton Ave
- 28 Belleview Ave
Your Personal Tour Guide
Ask me questions while you tour the home.