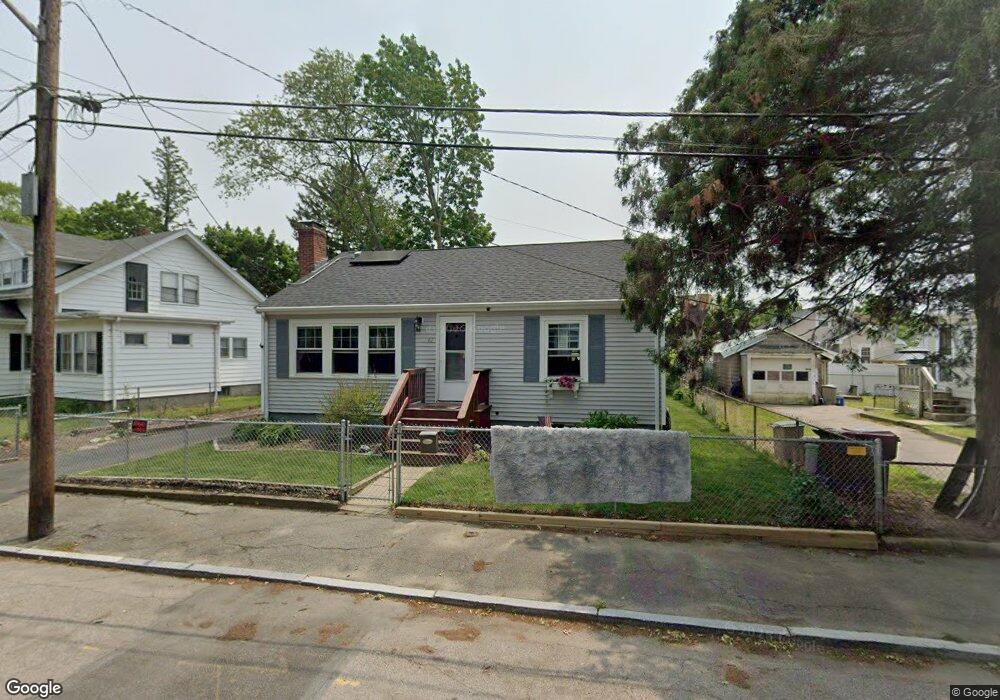
42 Linnea Ave Brockton, MA 02301
Clifton Heights NeighborhoodEstimated Value: $449,000 - $486,072
3
Beds
2
Baths
891
Sq Ft
$521/Sq Ft
Est. Value
About This Home
This home is located at 42 Linnea Ave, Brockton, MA 02301 and is currently estimated at $463,768, approximately $520 per square foot. 42 Linnea Ave is a home located in Plymouth County with nearby schools including Gilmore Elementary School, John F. Kennedy Elementary School, and Davis K-8 School.
Ownership History
Date
Name
Owned For
Owner Type
Purchase Details
Closed on
Jul 29, 2014
Sold by
Scrivani Michael L and Serivani Jennifer A
Bought by
Scrivani Michael L
Current Estimated Value
Purchase Details
Closed on
Jul 20, 2007
Sold by
Scrivani Michael L
Bought by
Scrivani Michael L and Scrivani Jennifer A
Home Financials for this Owner
Home Financials are based on the most recent Mortgage that was taken out on this home.
Original Mortgage
$255,780
Interest Rate
6.54%
Mortgage Type
Purchase Money Mortgage
Purchase Details
Closed on
May 2, 2003
Sold by
Rubin Scott B
Bought by
Scrivani Michael L
Purchase Details
Closed on
Feb 3, 2003
Sold by
Freitas Mario
Bought by
Rubin Scott B
Purchase Details
Closed on
Jul 23, 2001
Sold by
Oliviere Thomas E and Oliviere Carolyn M
Bought by
Freitas Mario
Create a Home Valuation Report for This Property
The Home Valuation Report is an in-depth analysis detailing your home's value as well as a comparison with similar homes in the area
Home Values in the Area
Average Home Value in this Area
Purchase History
| Date | Buyer | Sale Price | Title Company |
|---|---|---|---|
| Scrivani Michael L | -- | -- | |
| Scrivani Michael L | -- | -- | |
| Scrivani Michael L | $218,000 | -- | |
| Rubin Scott B | $157,000 | -- | |
| Freitas Mario | $175,000 | -- |
Source: Public Records
Mortgage History
| Date | Status | Borrower | Loan Amount |
|---|---|---|---|
| Previous Owner | Freitas Mario | $255,780 | |
| Previous Owner | Freitas Mario | $230,000 |
Source: Public Records
Tax History Compared to Growth
Tax History
| Year | Tax Paid | Tax Assessment Tax Assessment Total Assessment is a certain percentage of the fair market value that is determined by local assessors to be the total taxable value of land and additions on the property. | Land | Improvement |
|---|---|---|---|---|
| 2025 | $4,854 | $400,800 | $134,700 | $266,100 |
| 2024 | $4,738 | $394,200 | $134,700 | $259,500 |
| 2023 | $4,625 | $356,300 | $101,100 | $255,200 |
| 2022 | $4,208 | $301,200 | $91,600 | $209,600 |
| 2021 | $4,105 | $283,100 | $75,600 | $207,500 |
| 2020 | $4,204 | $277,500 | $71,500 | $206,000 |
| 2019 | $3,894 | $250,600 | $68,800 | $181,800 |
| 2018 | $3,360 | $209,200 | $68,800 | $140,400 |
| 2017 | $3,465 | $215,200 | $68,800 | $146,400 |
| 2016 | $3,264 | $188,000 | $66,700 | $121,300 |
| 2015 | $3,060 | $168,600 | $66,700 | $101,900 |
| 2014 | $3,051 | $168,300 | $66,700 | $101,600 |
Source: Public Records
Map
Nearby Homes