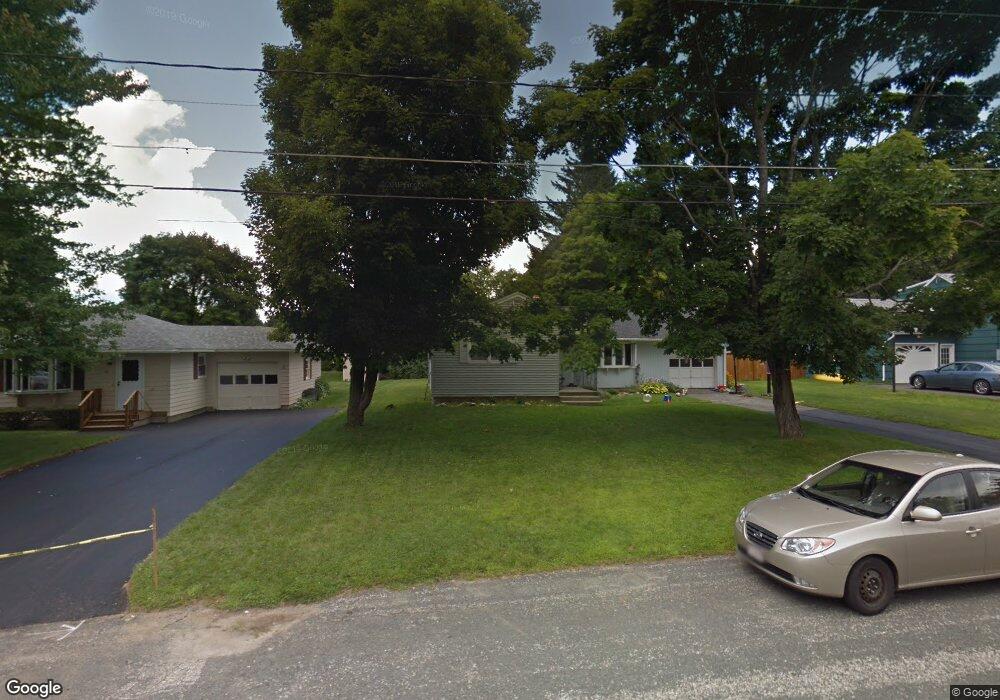
42 Lucia Dr Pittsfield, MA 01201
Estimated Value: $300,980 - $334,000
3
Beds
1
Bath
1,136
Sq Ft
$280/Sq Ft
Est. Value
About This Home
This home is located at 42 Lucia Dr, Pittsfield, MA 01201 and is currently estimated at $317,995, approximately $279 per square foot. 42 Lucia Dr is a home located in Berkshire County with nearby schools including Egremont Elementary School, Theodore Herberg Middle School, and Pittsfield High School.
Ownership History
Date
Name
Owned For
Owner Type
Purchase Details
Closed on
Sep 19, 2007
Sold by
Rochelo Crystal A and Desnoyers Crystal
Bought by
Desnoyers Crystal A and Rochelo Crystal A
Current Estimated Value
Home Financials for this Owner
Home Financials are based on the most recent Mortgage that was taken out on this home.
Original Mortgage
$93,250
Outstanding Balance
$59,221
Interest Rate
6.63%
Mortgage Type
Purchase Money Mortgage
Estimated Equity
$258,774
Purchase Details
Closed on
Aug 27, 2003
Sold by
Neff Anita M and Neff John W
Bought by
Rochelo Crystal A and Desnoyers David M
Home Financials for this Owner
Home Financials are based on the most recent Mortgage that was taken out on this home.
Original Mortgage
$96,000
Interest Rate
5.69%
Mortgage Type
Purchase Money Mortgage
Create a Home Valuation Report for This Property
The Home Valuation Report is an in-depth analysis detailing your home's value as well as a comparison with similar homes in the area
Home Values in the Area
Average Home Value in this Area
Purchase History
| Date | Buyer | Sale Price | Title Company |
|---|---|---|---|
| Desnoyers Crystal A | -- | -- | |
| Desnoyers Crystal A | -- | -- | |
| Desnoyers Crystal A | -- | -- | |
| Rochelo Crystal A | $120,000 | -- | |
| Rochelo Crystal A | $120,000 | -- | |
| Rochelo Crystal A | $120,000 | -- |
Source: Public Records
Mortgage History
| Date | Status | Borrower | Loan Amount |
|---|---|---|---|
| Open | Desnoyers Crystal A | $93,250 | |
| Closed | Desnoyers Crystal A | $93,250 | |
| Previous Owner | Rochelo Crystal A | $96,000 | |
| Previous Owner | Rochelo Crystal A | $30,000 |
Source: Public Records
Tax History Compared to Growth
Tax History
| Year | Tax Paid | Tax Assessment Tax Assessment Total Assessment is a certain percentage of the fair market value that is determined by local assessors to be the total taxable value of land and additions on the property. | Land | Improvement |
|---|---|---|---|---|
| 2025 | $4,340 | $241,900 | $90,300 | $151,600 |
| 2024 | $4,314 | $233,800 | $90,300 | $143,500 |
| 2023 | $4,082 | $222,800 | $90,300 | $132,500 |
| 2022 | $3,816 | $205,600 | $90,300 | $115,300 |
| 2021 | $3,669 | $190,600 | $90,300 | $100,300 |
| 2020 | $3,394 | $172,200 | $75,300 | $96,900 |
| 2019 | $3,195 | $164,500 | $70,300 | $94,200 |
| 2018 | $3,122 | $156,000 | $65,300 | $90,700 |
| 2017 | $2,799 | $142,600 | $55,300 | $87,300 |
| 2016 | $2,715 | $144,700 | $55,300 | $89,400 |
| 2015 | $2,613 | $144,700 | $55,300 | $89,400 |
Source: Public Records
Map
Nearby Homes
- 51 Anita Dr
- 75 Anita Dr
- 36 Joseph Dr
- 57 Joseph Dr
- 411 E New Lenox Rd
- 889 Holmes Rd
- 851 E New Lenox Rd
- 64 & 68 Brookside Dr
- 25 E New Lenox Rd
- 76 Alfred Dr
- 55 Revilla Terrace
- 49 Revilla Terrace
- 50 Bellmore Dr
- 59 Bellmore Dr
- 20 Marshall Ave
- 4 Filomena Dr
- 59 Joan Dr
- 106 Sampson Pkwy
- 40 Sampson Pkwy
- 35 Chapman Rd