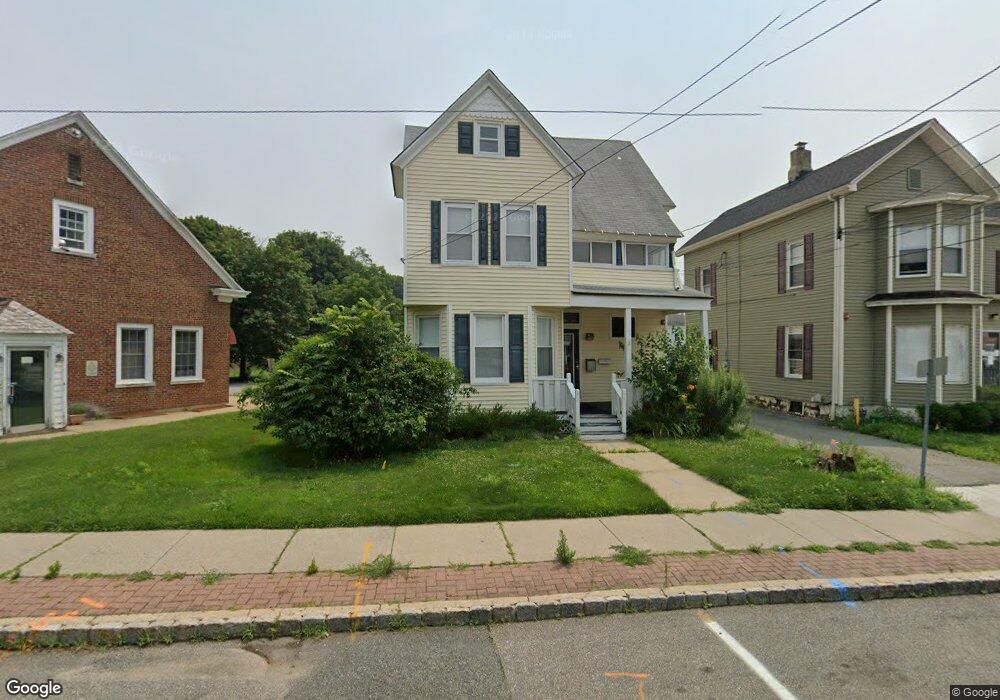
42 Main St Unit 2 Netcong, NJ 07857
Estimated Value: $439,524
2
Beds
1
Bath
2,393
Sq Ft
$184/Sq Ft
Est. Value
About This Home
This home is located at 42 Main St Unit 2, Netcong, NJ 07857 and is currently estimated at $439,524, approximately $183 per square foot. 42 Main St Unit 2 is a home located in Morris County with nearby schools including Netcong Elementary School, Lenape Val Regional High School, and Elite Preparatory Academy.
Ownership History
Date
Name
Owned For
Owner Type
Purchase Details
Closed on
Feb 10, 2025
Sold by
Wpk Realty Llc
Bought by
Rsb Netcong Llc
Current Estimated Value
Purchase Details
Closed on
Nov 15, 2006
Sold by
Rossi Anthony
Bought by
Wpk Realty Llc
Create a Home Valuation Report for This Property
The Home Valuation Report is an in-depth analysis detailing your home's value as well as a comparison with similar homes in the area
Home Values in the Area
Average Home Value in this Area
Purchase History
| Date | Buyer | Sale Price | Title Company |
|---|---|---|---|
| Rsb Netcong Llc | $405,000 | First American Title | |
| Rsb Netcong Llc | $405,000 | First American Title | |
| Wpk Realty Llc | $250,000 | -- |
Source: Public Records
Tax History
| Year | Tax Paid | Tax Assessment Tax Assessment Total Assessment is a certain percentage of the fair market value that is determined by local assessors to be the total taxable value of land and additions on the property. | Land | Improvement |
|---|---|---|---|---|
| 2025 | $11,043 | $313,100 | $91,200 | $221,900 |
| 2024 | $11,137 | $313,100 | $91,200 | $221,900 |
Source: Public Records
Map
Nearby Homes
- 74 Main St
- 79 Main St
- 16-18 King St
- 35 Hillside Ave
- 60 Stoll St Unit 9
- 4 Elizabeth Ave
- 64 Spino Dr
- 9 Spino Dr
- 58 Brooklyn Rd
- 7 Walton Place
- 2 Roberts Place
- 8 Hillside Ave
- 8 Spencer St
- 0 Lawrence Ave
- 329 Alpine Ct Unit 29
- 0 Swayze Pl Lawrence Ave
- 573 Dell Place Unit 73
- 71 U S Highway 206
- 579 Dell Place Unit 79
- 37 Fox Chase Ln
Your Personal Tour Guide
Ask me questions while you tour the home.