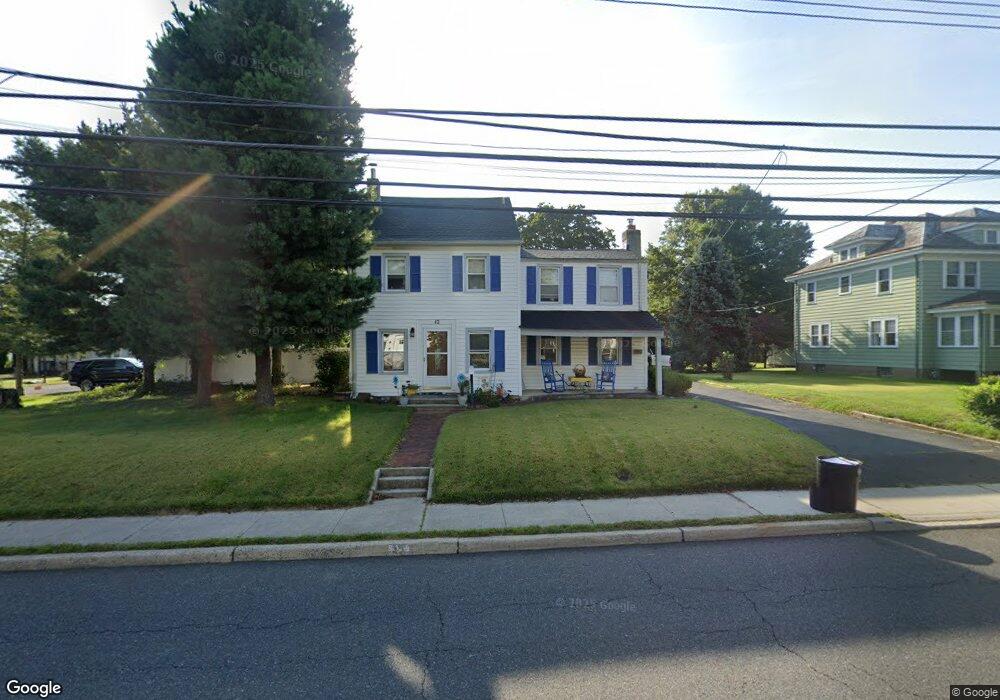
42 Main St Oceanport, NJ 07757
Estimated Value: $719,263 - $818,000
4
Beds
2
Baths
1,908
Sq Ft
$396/Sq Ft
Est. Value
About This Home
This home is located at 42 Main St, Oceanport, NJ 07757 and is currently estimated at $756,066, approximately $396 per square foot. 42 Main St is a home located in Monmouth County with nearby schools including Wolf Hill Elementary School, Maple Place Elementary and Middle School, and Shore Regional High School.
Ownership History
Date
Name
Owned For
Owner Type
Purchase Details
Closed on
Aug 24, 2004
Sold by
Gemignani Michael
Bought by
Calton John and Callahan Colleen
Current Estimated Value
Home Financials for this Owner
Home Financials are based on the most recent Mortgage that was taken out on this home.
Original Mortgage
$250,000
Outstanding Balance
$124,136
Interest Rate
6.02%
Estimated Equity
$631,930
Purchase Details
Closed on
Jul 12, 1999
Sold by
Chilton Victoria
Bought by
Gemignani Michael
Home Financials for this Owner
Home Financials are based on the most recent Mortgage that was taken out on this home.
Original Mortgage
$157,500
Interest Rate
7.65%
Purchase Details
Closed on
Jun 16, 1998
Sold by
Countrywide Home
Bought by
Chilton Andrew
Purchase Details
Closed on
Jan 26, 1997
Sold by
Palermo Anthony
Bought by
Rosenblum Paula
Home Financials for this Owner
Home Financials are based on the most recent Mortgage that was taken out on this home.
Original Mortgage
$75,000
Interest Rate
7.77%
Create a Home Valuation Report for This Property
The Home Valuation Report is an in-depth analysis detailing your home's value as well as a comparison with similar homes in the area
Home Values in the Area
Average Home Value in this Area
Purchase History
| Date | Buyer | Sale Price | Title Company |
|---|---|---|---|
| Calton John | $395,000 | -- | |
| Gemignani Michael | $210,000 | -- | |
| Chilton Andrew | $40,000 | -- | |
| Rosenblum Paula | $325,000 | -- |
Source: Public Records
Mortgage History
| Date | Status | Borrower | Loan Amount |
|---|---|---|---|
| Open | Calton John | $250,000 | |
| Previous Owner | Gemignani Michael | $157,500 | |
| Previous Owner | Rosenblum Paula | $75,000 |
Source: Public Records
Tax History
| Year | Tax Paid | Tax Assessment Tax Assessment Total Assessment is a certain percentage of the fair market value that is determined by local assessors to be the total taxable value of land and additions on the property. | Land | Improvement |
|---|---|---|---|---|
| 2025 | $9,056 | $574,100 | $331,500 | $242,600 |
| 2024 | $8,867 | $573,500 | $302,700 | $270,800 |
| 2023 | $8,867 | $532,900 | $275,700 | $257,200 |
| 2022 | $7,891 | $472,500 | $246,000 | $226,500 |
| 2021 | $7,891 | $434,400 | $219,000 | $215,400 |
| 2020 | $7,462 | $408,200 | $196,500 | $211,700 |
| 2019 | $7,056 | $391,800 | $187,500 | $204,300 |
| 2018 | $6,965 | $389,300 | $187,500 | $201,800 |
| 2017 | $7,707 | $357,300 | $167,300 | $190,000 |
| 2016 | $7,816 | $364,700 | $178,300 | $186,400 |
| 2015 | $7,464 | $359,900 | $178,300 | $181,600 |
| 2014 | $7,145 | $349,400 | $188,300 | $161,100 |
Source: Public Records
Map
Nearby Homes
- 66 Pemberton Ave
- 37 Steeplechase Ct
- 14 Oceanport Ave
- 10 Sunset Rd
- 3 Sandbar Aly
- 15 Maple Ave
- 0 Elkwood Ave
- 25 Monmouth Rd Unit 2
- 24 Burntmill Cir
- 35 Avon Ave
- 20 Rivers Edge Dr
- 58 Monmouth Rd
- 265 Port Au Peck Ave
- 28 Fairfield Ave
- 10 Asbury Ave
- 11 Avon Ave
- 8 Hialeah
- 12 Balmer Ct
- 73 Northvale Ave
- 1 Foggia Way
Your Personal Tour Guide
Ask me questions while you tour the home.