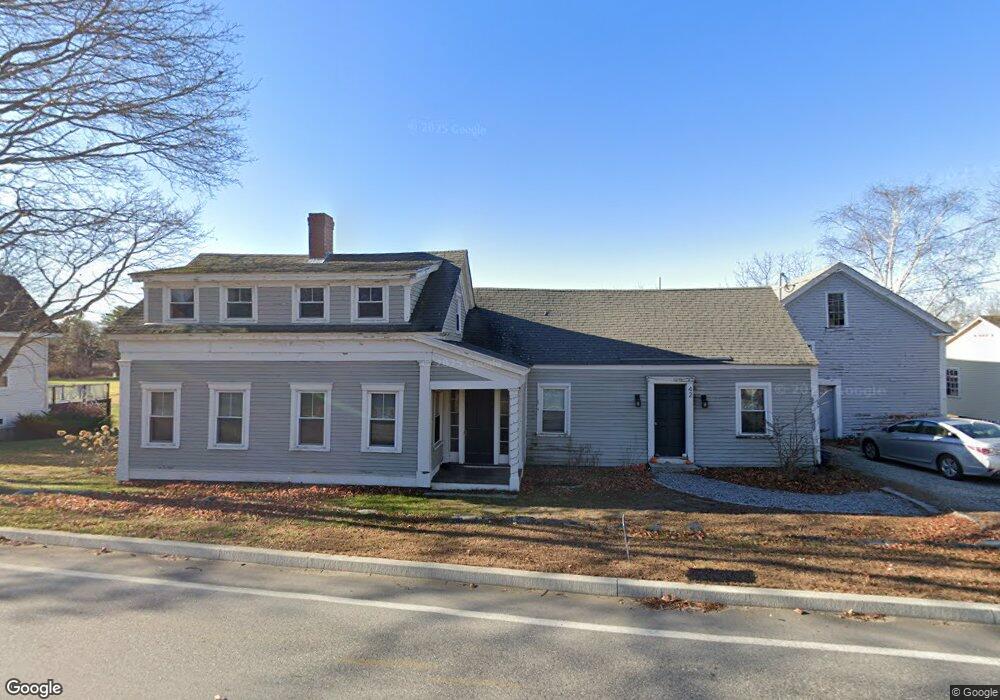
42 Main St Raymond, ME 04071
Estimated Value: $307,414 - $452,000
3
Beds
1
Bath
1,034
Sq Ft
$364/Sq Ft
Est. Value
About This Home
This home is located at 42 Main St, Raymond, ME 04071 and is currently estimated at $376,604, approximately $364 per square foot. 42 Main St is a home located in Cumberland County with nearby schools including Raymond Elementary School, Jordan-Small Middle School, and Windham High School.
Ownership History
Date
Name
Owned For
Owner Type
Purchase Details
Closed on
Oct 1, 2013
Sold by
Obrion 3Rd James J
Bought by
Obrion 3Rd James J and Obrion Ashley B
Current Estimated Value
Home Financials for this Owner
Home Financials are based on the most recent Mortgage that was taken out on this home.
Original Mortgage
$115,000
Outstanding Balance
$86,145
Interest Rate
4.42%
Mortgage Type
Purchase Money Mortgage
Estimated Equity
$290,459
Purchase Details
Closed on
Feb 2, 2009
Sold by
Obrion James J and Obrion Linda L
Bought by
Obrion 3Rd James J
Home Financials for this Owner
Home Financials are based on the most recent Mortgage that was taken out on this home.
Original Mortgage
$103,000
Interest Rate
5.28%
Mortgage Type
Purchase Money Mortgage
Purchase Details
Closed on
Jun 2, 2008
Sold by
Downeast Mortgage Corp
Bought by
Obrion James J and Obrion Linda L
Purchase Details
Closed on
Jan 24, 2008
Sold by
Downeast Mortgage Corp
Bought by
Downeast Mortgage Corp
Create a Home Valuation Report for This Property
The Home Valuation Report is an in-depth analysis detailing your home's value as well as a comparison with similar homes in the area
Home Values in the Area
Average Home Value in this Area
Purchase History
| Date | Buyer | Sale Price | Title Company |
|---|---|---|---|
| Obrion 3Rd James J | -- | -- | |
| Obrion 3Rd James J | -- | -- | |
| Obrion James J | -- | -- | |
| Downeast Mortgage Corp | -- | -- |
Source: Public Records
Mortgage History
| Date | Status | Borrower | Loan Amount |
|---|---|---|---|
| Open | Obrion 3Rd James J | $115,000 | |
| Closed | Downeast Mortgage Corp | $103,000 |
Source: Public Records
Tax History Compared to Growth
Tax History
| Year | Tax Paid | Tax Assessment Tax Assessment Total Assessment is a certain percentage of the fair market value that is determined by local assessors to be the total taxable value of land and additions on the property. | Land | Improvement |
|---|---|---|---|---|
| 2024 | $2,021 | $117,500 | $20,400 | $97,100 |
| 2023 | $1,868 | $117,500 | $20,400 | $97,100 |
| 2022 | $1,763 | $117,500 | $20,400 | $97,100 |
| 2021 | $1,657 | $117,500 | $20,400 | $97,100 |
| 2019 | $1,580 | $117,500 | $20,400 | $97,100 |
| 2018 | $3,928 | $117,500 | $20,400 | $97,100 |
| 2017 | $1,445 | $117,500 | $20,400 | $97,100 |
| 2016 | $1,422 | $117,500 | $20,400 | $97,100 |
| 2015 | $1,404 | $117,500 | $20,400 | $97,100 |
| 2014 | $1,387 | $117,500 | $20,400 | $97,100 |
| 2013 | $1,322 | $117,500 | $20,400 | $97,100 |
Source: Public Records
Map
Nearby Homes
- 7 Salmon Run
- 6 Williams Ln
- 2 Flynn Rd
- 35 Webbs Mills Rd
- 105 Meadow Rd
- 16 Peterson Rd
- 34 Stoney Brook Rd
- 1 Pine Ln
- 24 Hillside Dr
- 18 Hillside Dr
- 107 Harvest Hill Rd
- 17 Murray Dr
- 12 Presidential View
- 20 Bittersweet Way
- 7 Gore Rd
- 0 Heidi Way
- 1569 Roosevelt Trail
- 89 Shaw Rd
- 1083 Roosevelt Trail
- 15 Worcester Dr