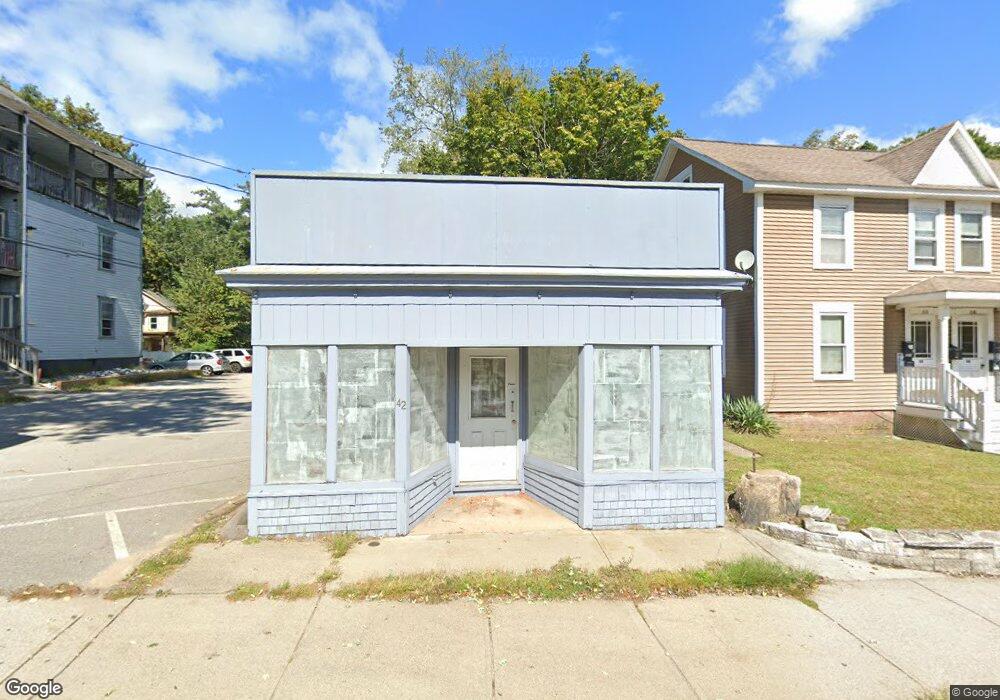
42 Main St Southbridge, MA 01550
Estimated Value: $505,747
--
Bed
4
Baths
--
Sq Ft
0.61
Acres
About This Home
This home is located at 42 Main St, Southbridge, MA 01550 and is currently priced at $505,747. 42 Main St is a home located in Worcester County with nearby schools including Trinity Catholic Academy and ViewPoint Christian Academy.
Ownership History
Date
Name
Owned For
Owner Type
Purchase Details
Closed on
Feb 17, 2009
Sold by
Dugan John G
Bought by
Singvongsa Hortencia and Singvongsa Phet
Current Estimated Value
Home Financials for this Owner
Home Financials are based on the most recent Mortgage that was taken out on this home.
Original Mortgage
$95,000
Outstanding Balance
$60,564
Interest Rate
5.26%
Mortgage Type
Commercial
Purchase Details
Closed on
Feb 5, 2001
Sold by
Brodeur Robert and Brodeur Jeannette A
Bought by
Chicoine Roger D and Chicoine Norman W
Home Financials for this Owner
Home Financials are based on the most recent Mortgage that was taken out on this home.
Original Mortgage
$120,000
Interest Rate
7.14%
Mortgage Type
Purchase Money Mortgage
Create a Home Valuation Report for This Property
The Home Valuation Report is an in-depth analysis detailing your home's value as well as a comparison with similar homes in the area
Home Values in the Area
Average Home Value in this Area
Purchase History
| Date | Buyer | Sale Price | Title Company |
|---|---|---|---|
| Singvongsa Hortencia | $235,000 | -- | |
| Singvongsa Hortencia | $235,000 | -- | |
| Chicoine Roger D | $160,000 | -- |
Source: Public Records
Mortgage History
| Date | Status | Borrower | Loan Amount |
|---|---|---|---|
| Open | Singvongsa Hortencia | $95,000 | |
| Closed | Chicoine Roger D | $95,000 | |
| Previous Owner | Chicoine Roger D | $120,000 |
Source: Public Records
Tax History Compared to Growth
Tax History
| Year | Tax Paid | Tax Assessment Tax Assessment Total Assessment is a certain percentage of the fair market value that is determined by local assessors to be the total taxable value of land and additions on the property. | Land | Improvement |
|---|---|---|---|---|
| 2025 | $11,791 | $804,300 | $77,600 | $726,700 |
| 2024 | $7,197 | $471,600 | $73,900 | $397,700 |
| 2023 | $6,650 | $419,800 | $73,900 | $345,900 |
| 2022 | $6,421 | $358,700 | $68,100 | $290,600 |
| 2021 | $6,664 | $342,800 | $68,100 | $274,700 |
| 2020 | $6,528 | $335,100 | $68,100 | $267,000 |
| 2018 | $5,683 | $273,900 | $64,600 | $209,300 |
| 2017 | $5,210 | $253,300 | $64,600 | $188,700 |
| 2016 | $4,996 | $247,200 | $64,600 | $182,600 |
| 2015 | $5,328 | $261,700 | $51,600 | $210,100 |
| 2014 | $5,140 | $261,700 | $51,600 | $210,100 |
Source: Public Records
Map
Nearby Homes