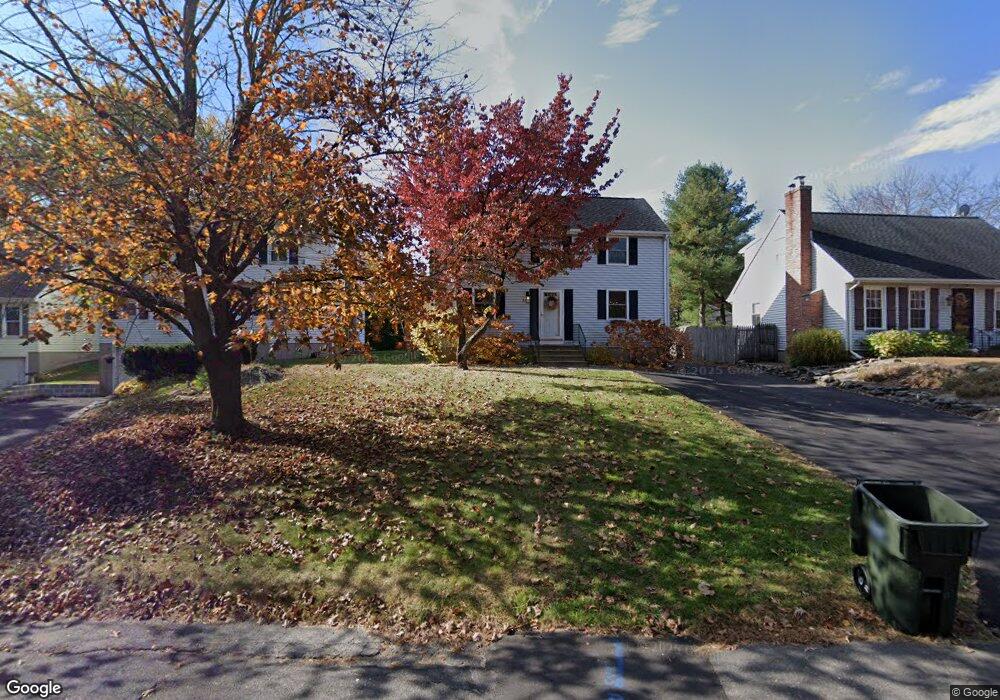
42 Makara St Pequabuck, CT 06781
Estimated Value: $309,000 - $336,000
3
Beds
2
Baths
1,344
Sq Ft
$238/Sq Ft
Est. Value
About This Home
This home is located at 42 Makara St, Pequabuck, CT 06781 and is currently estimated at $319,761, approximately $237 per square foot. 42 Makara St is a home with nearby schools including Harry S. Fisher Elementary School, Eli Terry Jr. Middle School, and Terryville High School.
Ownership History
Date
Name
Owned For
Owner Type
Purchase Details
Closed on
Sep 8, 2023
Sold by
Waldros Wayne
Bought by
Pelletier Elizabeth J and Rivera Reuben J
Current Estimated Value
Home Financials for this Owner
Home Financials are based on the most recent Mortgage that was taken out on this home.
Original Mortgage
$255,000
Outstanding Balance
$248,977
Interest Rate
6.38%
Mortgage Type
Purchase Money Mortgage
Estimated Equity
$70,784
Purchase Details
Closed on
Aug 9, 1993
Sold by
Russell James A and Russell Kathleen M
Bought by
Smith David L and Smith Heidi H
Home Financials for this Owner
Home Financials are based on the most recent Mortgage that was taken out on this home.
Original Mortgage
$117,900
Interest Rate
6.7%
Mortgage Type
Purchase Money Mortgage
Create a Home Valuation Report for This Property
The Home Valuation Report is an in-depth analysis detailing your home's value as well as a comparison with similar homes in the area
Home Values in the Area
Average Home Value in this Area
Purchase History
| Date | Buyer | Sale Price | Title Company |
|---|---|---|---|
| Pelletier Elizabeth J | $283,000 | None Available | |
| Pelletier Elizabeth J | $283,000 | None Available | |
| Pelletier Elizabeth J | $283,000 | None Available | |
| Smith David L | $118,000 | -- | |
| Smith David L | $118,000 | -- |
Source: Public Records
Mortgage History
| Date | Status | Borrower | Loan Amount |
|---|---|---|---|
| Open | Pelletier Elizabeth J | $255,000 | |
| Closed | Pelletier Elizabeth J | $255,000 | |
| Previous Owner | Smith David L | $178,000 | |
| Previous Owner | Smith David L | $117,900 | |
| Previous Owner | Smith David L | $70,000 |
Source: Public Records
Tax History Compared to Growth
Tax History
| Year | Tax Paid | Tax Assessment Tax Assessment Total Assessment is a certain percentage of the fair market value that is determined by local assessors to be the total taxable value of land and additions on the property. | Land | Improvement |
|---|---|---|---|---|
| 2025 | $5,271 | $133,210 | $41,860 | $91,350 |
| 2024 | $5,147 | $133,210 | $41,860 | $91,350 |
| 2023 | $4,806 | $127,470 | $41,860 | $85,610 |
| 2022 | $4,630 | $127,470 | $41,860 | $85,610 |
| 2021 | $4,030 | $99,183 | $40,740 | $58,443 |
| 2020 | $4,030 | $99,183 | $40,740 | $58,443 |
| 2019 | $4,030 | $99,183 | $40,740 | $58,443 |
| 2016 | $3,830 | $106,323 | $40,740 | $65,583 |
| 2015 | $3,767 | $106,323 | $40,740 | $65,583 |
| 2014 | $3,705 | $106,323 | $40,740 | $65,583 |
Source: Public Records
Map
Nearby Homes
- Lots 16, 18 and 22 E Hill St
- 19 Main St
- 78 Kearney St
- 11 William St
- 7 Kearney St
- 14 Church St
- 15 Woodside Ln
- 10 Liberty St
- 28 Allen St
- 441 Clark Ave Unit 2
- 441 Clark Ave Unit 5
- 7 Allen St
- 565 Clark Ave Unit 17
- 21 Coral Dr
- 21 Laurel Ave
- 10 Diamond St
- 2 Sandra Ave
- 820 Matthews St Unit 29
- 120 Barlow St
- 69 E Washington Rd