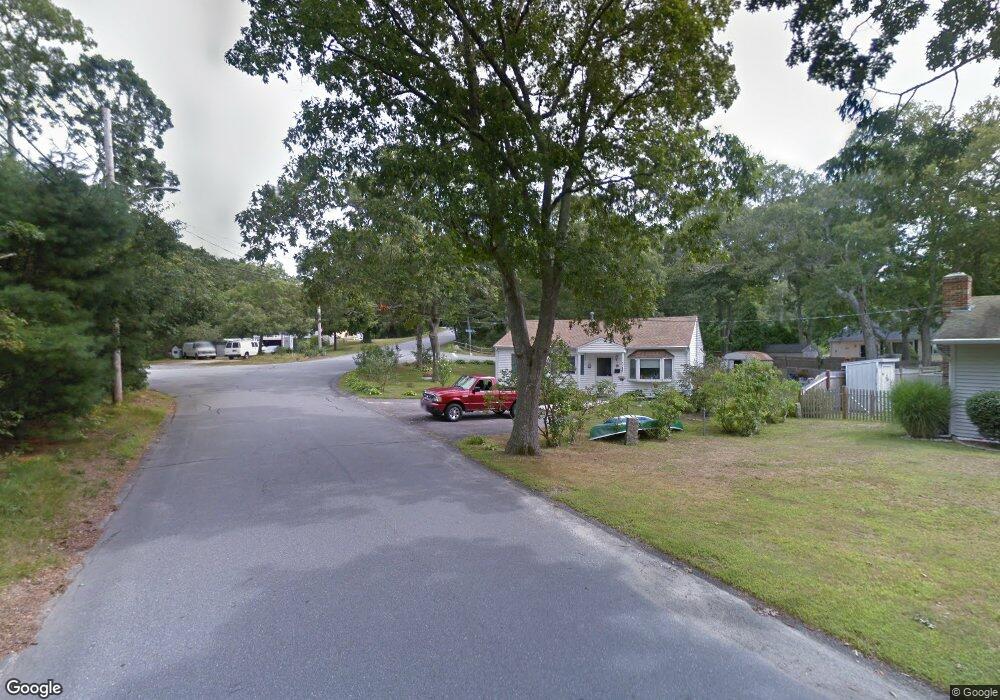
42 Maple St Bourne, MA 02532
Buzzards Bay NeighborhoodEstimated Value: $407,511 - $434,000
3
Beds
1
Bath
840
Sq Ft
$496/Sq Ft
Est. Value
About This Home
This home is located at 42 Maple St, Bourne, MA 02532 and is currently estimated at $416,628, approximately $495 per square foot. 42 Maple St is a home located in Barnstable County with nearby schools including Bourne High School and St Margaret Regional School.
Ownership History
Date
Name
Owned For
Owner Type
Purchase Details
Closed on
Apr 2, 2018
Sold by
Fantozzi Sandra L
Bought by
Fantozzi Sandra L and Fantozzi Charles
Current Estimated Value
Purchase Details
Closed on
Aug 31, 2007
Sold by
Ariagno John and Ariagno Laurette A
Bought by
Moses Lewis T and Moses Sandra L
Home Financials for this Owner
Home Financials are based on the most recent Mortgage that was taken out on this home.
Original Mortgage
$130,130
Interest Rate
6.71%
Mortgage Type
Purchase Money Mortgage
Create a Home Valuation Report for This Property
The Home Valuation Report is an in-depth analysis detailing your home's value as well as a comparison with similar homes in the area
Home Values in the Area
Average Home Value in this Area
Purchase History
| Date | Buyer | Sale Price | Title Company |
|---|---|---|---|
| Fantozzi Sandra L | -- | -- | |
| Fantozzi Sandra L | -- | -- | |
| Moses Lewis T | $169,000 | -- | |
| Moses Lewis T | $169,000 | -- |
Source: Public Records
Mortgage History
| Date | Status | Borrower | Loan Amount |
|---|---|---|---|
| Previous Owner | Moses Lewis T | $130,130 | |
| Previous Owner | Moses Lewis T | $33,800 |
Source: Public Records
Tax History
| Year | Tax Paid | Tax Assessment Tax Assessment Total Assessment is a certain percentage of the fair market value that is determined by local assessors to be the total taxable value of land and additions on the property. | Land | Improvement |
|---|---|---|---|---|
| 2025 | $2,459 | $314,800 | $183,900 | $130,900 |
| 2024 | $2,404 | $299,800 | $175,100 | $124,700 |
| 2023 | $2,337 | $265,300 | $155,000 | $110,300 |
| 2022 | $2,229 | $220,900 | $137,100 | $83,800 |
| 2021 | $2,166 | $201,100 | $124,800 | $76,300 |
| 2020 | $2,104 | $195,900 | $123,600 | $72,300 |
| 2019 | $2,016 | $191,800 | $123,600 | $68,200 |
| 2018 | $1,890 | $179,300 | $117,800 | $61,500 |
| 2017 | $1,828 | $177,500 | $116,600 | $60,900 |
| 2016 | $1,680 | $165,400 | $116,600 | $48,800 |
| 2015 | $1,666 | $165,400 | $116,600 | $48,800 |
Source: Public Records
Map
Nearby Homes
- 48 Maple St
- 58 Maple St
- 23 Alderberry Rd
- 304 Main St
- 46 Holt Rd Unit B
- 46 Holt Rd
- 38 Old Bridge Rd
- 6 Honora Ct
- 3 Honora Ln Unit 3
- 40-A Lafayette Ave
- 4 Van Bummel Rd
- 60 Sandwich Rd
- 810 Head of The Bay Rd
- 9 Hideaway Rd Unit F
- 13 Hideaway Village Unit G
- 44 Cotuit Rd
- 10 Sandy Ln
- 60 Bourne Neck Dr
- 5 Zoli Ln
- 11 Buzzards Bay Dr
Your Personal Tour Guide
Ask me questions while you tour the home.