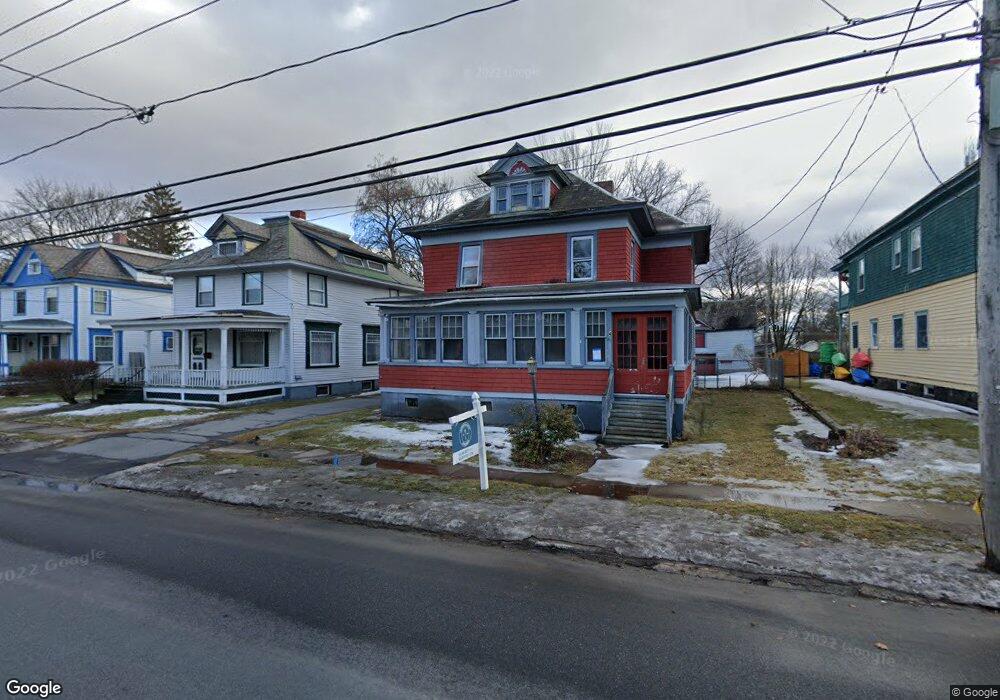
42 Maple St Unit 1 Hudson Falls, NY 12839
Estimated Value: $231,000 - $279,029
3
Beds
2
Baths
2,100
Sq Ft
$126/Sq Ft
Est. Value
About This Home
This home is located at 42 Maple St Unit 1, Hudson Falls, NY 12839 and is currently estimated at $263,757, approximately $125 per square foot. 42 Maple St Unit 1 is a home located in Washington County with nearby schools including Margaret Murphy Kindergarten Center, Hudson Falls Intermediate School, and Hudson Falls Primary School.
Ownership History
Date
Name
Owned For
Owner Type
Purchase Details
Closed on
Mar 16, 2024
Sold by
D & T Creative Prop Llc
Bought by
Berger Douglas and Berger Jaymie
Current Estimated Value
Home Financials for this Owner
Home Financials are based on the most recent Mortgage that was taken out on this home.
Original Mortgage
$208,250
Outstanding Balance
$204,620
Interest Rate
6.38%
Mortgage Type
Adjustable Rate Mortgage/ARM
Estimated Equity
$59,137
Purchase Details
Closed on
Dec 23, 2022
Sold by
Murray Franklin R and Murray Carole G
Bought by
D & T Creative Prop Llc
Create a Home Valuation Report for This Property
The Home Valuation Report is an in-depth analysis detailing your home's value as well as a comparison with similar homes in the area
Home Values in the Area
Average Home Value in this Area
Purchase History
| Date | Buyer | Sale Price | Title Company |
|---|---|---|---|
| Berger Douglas | $245,000 | Misc Company | |
| Berger Douglas | $245,000 | Misc Company | |
| D & T Creative Prop Llc | $87,500 | None Available |
Source: Public Records
Mortgage History
| Date | Status | Borrower | Loan Amount |
|---|---|---|---|
| Open | Berger Douglas | $208,250 | |
| Closed | Berger Douglas | $208,250 |
Source: Public Records
Tax History Compared to Growth
Tax History
| Year | Tax Paid | Tax Assessment Tax Assessment Total Assessment is a certain percentage of the fair market value that is determined by local assessors to be the total taxable value of land and additions on the property. | Land | Improvement |
|---|---|---|---|---|
| 2024 | $2,265 | $87,500 | $11,900 | $75,600 |
| 2023 | $4,548 | $170,000 | $11,900 | $158,100 |
| 2022 | $4,599 | $170,000 | $11,900 | $158,100 |
| 2021 | $4,410 | $153,500 | $11,900 | $141,600 |
| 2020 | $8,423 | $138,600 | $11,900 | $126,700 |
| 2019 | $8,499 | $138,600 | $11,900 | $126,700 |
| 2018 | $8,499 | $130,800 | $11,900 | $118,900 |
| 2017 | $8,063 | $130,800 | $11,900 | $118,900 |
| 2016 | $4,098 | $128,200 | $11,900 | $116,300 |
| 2015 | -- | $128,200 | $11,900 | $116,300 |
| 2014 | -- | $128,200 | $11,900 | $116,300 |
Source: Public Records
Map
Nearby Homes