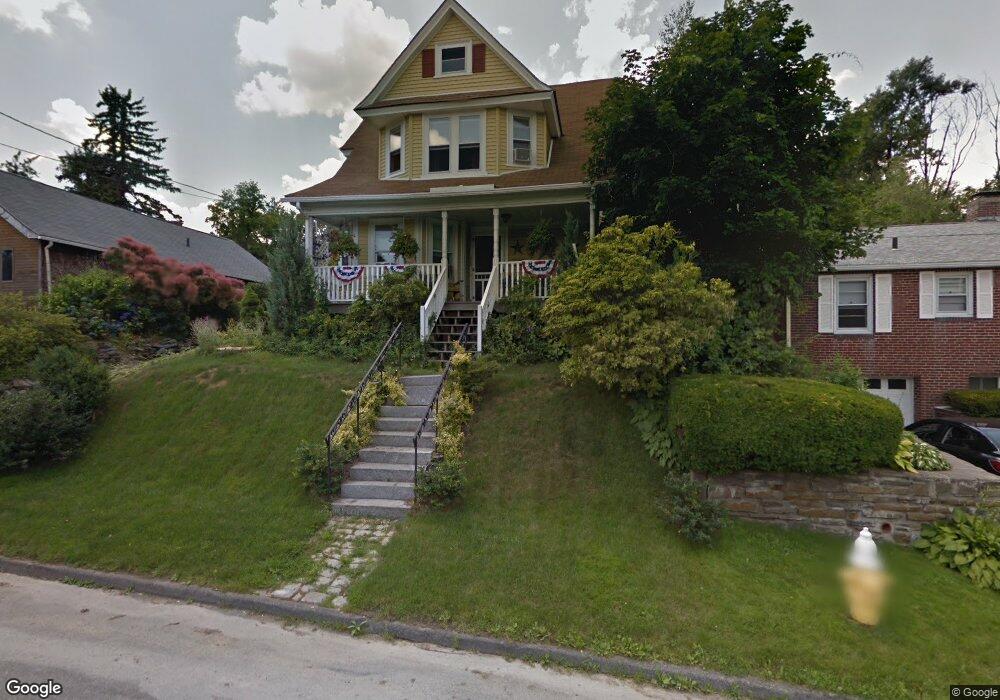
42 Marsh Ave Worcester, MA 01605
Estimated Value: $371,000 - $486,000
3
Beds
2
Baths
2,165
Sq Ft
$208/Sq Ft
Est. Value
About This Home
This home is located at 42 Marsh Ave, Worcester, MA 01605 and is currently estimated at $450,374, approximately $208 per square foot. 42 Marsh Ave is a home located in Worcester County with nearby schools including Jacob Hiatt Magnet School, Chandler Magnet, and Lincoln Street School.
Ownership History
Date
Name
Owned For
Owner Type
Purchase Details
Closed on
Aug 3, 2022
Sold by
Douglas W Matthews Ret
Bought by
Matthews Douglas W
Current Estimated Value
Purchase Details
Closed on
Jul 15, 1992
Sold by
Perch Peter
Bought by
Donahue Lori A and Mathews Douglas W
Create a Home Valuation Report for This Property
The Home Valuation Report is an in-depth analysis detailing your home's value as well as a comparison with similar homes in the area
Purchase History
| Date | Buyer | Sale Price | Title Company |
|---|---|---|---|
| Matthews Douglas W | -- | None Available | |
| Donahue Lori A | $75,000 | -- |
Source: Public Records
Mortgage History
| Date | Status | Borrower | Loan Amount |
|---|---|---|---|
| Previous Owner | Donahue Lori A | $142,500 | |
| Previous Owner | Donahue Lori A | $52,900 | |
| Previous Owner | Donahue Lori A | $35,300 |
Source: Public Records
Tax History
| Year | Tax Paid | Tax Assessment Tax Assessment Total Assessment is a certain percentage of the fair market value that is determined by local assessors to be the total taxable value of land and additions on the property. | Land | Improvement |
|---|---|---|---|---|
| 2025 | $5,624 | $426,400 | $107,900 | $318,500 |
| 2024 | $5,352 | $389,200 | $107,900 | $281,300 |
| 2023 | $5,161 | $359,900 | $93,800 | $266,100 |
| 2022 | $4,779 | $314,200 | $75,100 | $239,100 |
| 2021 | $4,866 | $298,900 | $60,100 | $238,800 |
| 2020 | $4,599 | $270,500 | $60,100 | $210,400 |
| 2019 | $4,417 | $245,400 | $54,000 | $191,400 |
| 2018 | $4,387 | $232,000 | $54,000 | $178,000 |
| 2017 | $4,177 | $217,300 | $54,000 | $163,300 |
| 2016 | $4,242 | $205,800 | $40,900 | $164,900 |
| 2015 | $4,130 | $205,800 | $40,900 | $164,900 |
| 2014 | $4,021 | $205,800 | $40,900 | $164,900 |
Source: Public Records
Map
Nearby Homes
Your Personal Tour Guide
Ask me questions while you tour the home.