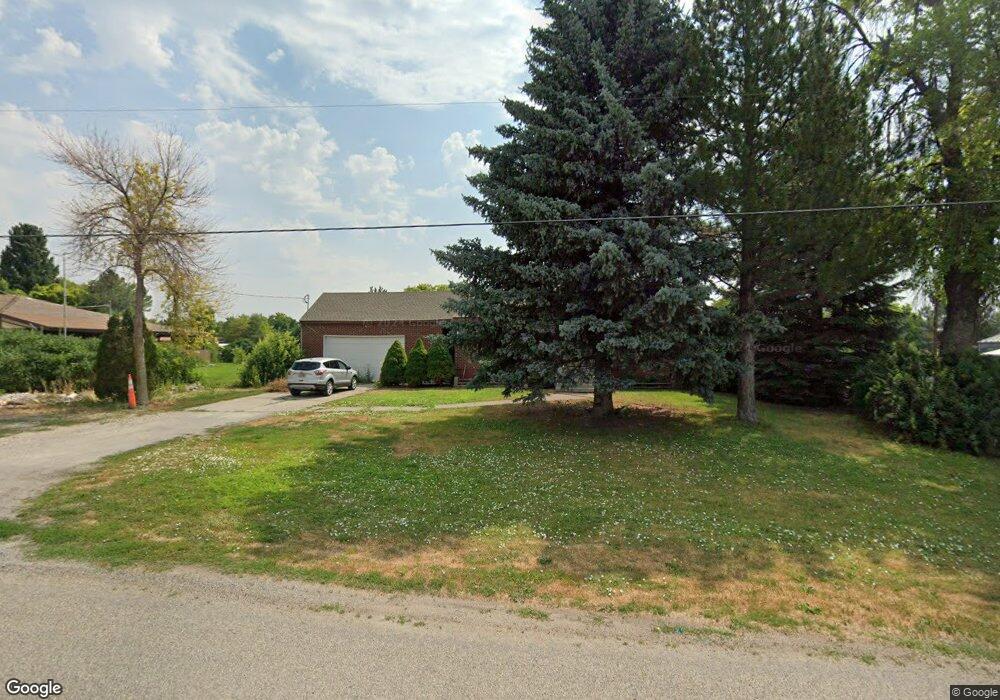
42 N Center St Newton, UT 84327
Estimated Value: $350,825 - $410,000
--
Bed
--
Bath
1,314
Sq Ft
$290/Sq Ft
Est. Value
About This Home
This home is located at 42 N Center St, Newton, UT 84327 and is currently estimated at $381,456, approximately $290 per square foot. 42 N Center St is a home with nearby schools including Lewiston School, White Pine Middle School, and North Cache Middle School.
Ownership History
Date
Name
Owned For
Owner Type
Purchase Details
Closed on
Oct 13, 2021
Sold by
Bartlett Cody E and Bartlett Alicia M
Bought by
Bartlett Alicia M and Bartlett Cody E
Current Estimated Value
Home Financials for this Owner
Home Financials are based on the most recent Mortgage that was taken out on this home.
Original Mortgage
$165,000
Outstanding Balance
$125,945
Interest Rate
2.1%
Mortgage Type
New Conventional
Estimated Equity
$255,511
Purchase Details
Closed on
Nov 9, 2018
Sold by
Benson Carolyn W and The Kay H Benson Trust
Bought by
Bartlett Cody E and Bartlett Alicia M
Home Financials for this Owner
Home Financials are based on the most recent Mortgage that was taken out on this home.
Original Mortgage
$190,000
Interest Rate
4.7%
Mortgage Type
New Conventional
Purchase Details
Closed on
Mar 3, 2005
Sold by
Benson Kay H and Benson Carolyn W
Bought by
Benson Kay H and Benson Carolyn W
Create a Home Valuation Report for This Property
The Home Valuation Report is an in-depth analysis detailing your home's value as well as a comparison with similar homes in the area
Home Values in the Area
Average Home Value in this Area
Purchase History
| Date | Buyer | Sale Price | Title Company |
|---|---|---|---|
| Bartlett Alicia M | -- | Northern Title Company | |
| Bartlett Cody E | -- | Cache Title Logan | |
| Benson Kay H | -- | None Available |
Source: Public Records
Mortgage History
| Date | Status | Borrower | Loan Amount |
|---|---|---|---|
| Open | Bartlett Alicia M | $165,000 | |
| Closed | Bartlett Cody E | $190,000 |
Source: Public Records
Tax History Compared to Growth
Tax History
| Year | Tax Paid | Tax Assessment Tax Assessment Total Assessment is a certain percentage of the fair market value that is determined by local assessors to be the total taxable value of land and additions on the property. | Land | Improvement |
|---|---|---|---|---|
| 2025 | $1,952 | $284,780 | $0 | $0 |
| 2024 | $142 | $190,090 | $0 | $0 |
| 2023 | $1,500 | $189,210 | $0 | $0 |
| 2022 | $1,570 | $189,215 | $0 | $0 |
| 2021 | $1,498 | $271,770 | $76,720 | $195,050 |
| 2020 | $1,344 | $227,220 | $76,720 | $150,500 |
| 2019 | $1,280 | $203,290 | $52,790 | $150,500 |
| 2018 | $1,221 | $192,102 | $52,790 | $139,312 |
| 2017 | $1,184 | $99,720 | $0 | $0 |
| 2016 | $1,199 | $99,720 | $0 | $0 |
| 2015 | $1,201 | $99,720 | $0 | $0 |
| 2014 | $1,200 | $101,920 | $0 | $0 |
| 2013 | -- | $98,730 | $0 | $0 |
Source: Public Records
Map
Nearby Homes
- 312 W 200 N Unit 10
- 222 W 200 N Unit 18
- 165 W 200 N
- 136 W 200 N Unit 21
- 244 W 200 N Unit 17
- 260 W 200 N Unit 16
- 158 W 200 N Unit 20
- 116 W 200 N Unit 22
- 362 W 200 N Unit 8
- 340 W 200 N Unit 9
- 115 N 100 W Unit 23
- 180 N 300 W
- 144 N 300 W Unit 13
- 141 N 300 W Unit 12
- 165 N 300 W Unit 11
- 172 N 300 W Unit 14
- 15 S 400 W
- 7900 N 5600 W
- 9000 N 6400 W
- 145 S 400 W