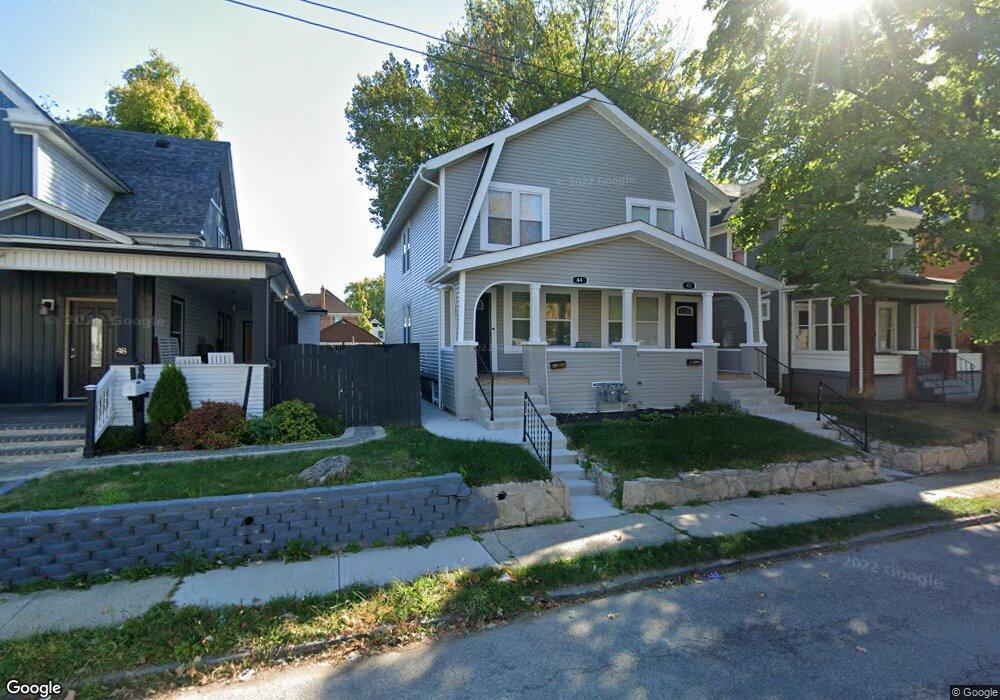
42 N Harris Ave Unit 44 Columbus, OH 43204
North Hilltop NeighborhoodEstimated Value: $224,000 - $318,000
6
Beds
2
Baths
2,778
Sq Ft
$99/Sq Ft
Est. Value
About This Home
This home is located at 42 N Harris Ave Unit 44, Columbus, OH 43204 and is currently estimated at $274,966, approximately $98 per square foot. 42 N Harris Ave Unit 44 is a home located in Franklin County with nearby schools including West Broad Elementary School, Westmoor Middle School, and West High School.
Ownership History
Date
Name
Owned For
Owner Type
Purchase Details
Closed on
Jun 2, 2022
Sold by
Eagle Homes Properties Inc
Bought by
Sashington Sasha
Current Estimated Value
Home Financials for this Owner
Home Financials are based on the most recent Mortgage that was taken out on this home.
Original Mortgage
$291,000
Outstanding Balance
$276,499
Interest Rate
5.11%
Mortgage Type
New Conventional
Estimated Equity
-$1,533
Purchase Details
Closed on
May 21, 2021
Sold by
Vasquez Silvia
Bought by
Eagle Homes Properties Inc
Purchase Details
Closed on
Mar 26, 2020
Sold by
Wotring Thomas T and Wotring Nickki J
Bought by
Vasquez Sylvia
Purchase Details
Closed on
Jan 4, 2010
Sold by
Davlong Richard L
Bought by
Wotring Thomas T and Wotring Nickki J
Purchase Details
Closed on
May 11, 1978
Bought by
Daylong Richard L
Create a Home Valuation Report for This Property
The Home Valuation Report is an in-depth analysis detailing your home's value as well as a comparison with similar homes in the area
Home Values in the Area
Average Home Value in this Area
Purchase History
| Date | Buyer | Sale Price | Title Company |
|---|---|---|---|
| Sashington Sasha | $305,000 | First American Title | |
| Eagle Homes Properties Inc | $60,000 | Northwest Advantage Ttl Agcy | |
| Vasquez Sylvia | $15,011 | None Available | |
| Wotring Thomas T | $30,500 | Attorney | |
| Daylong Richard L | -- | -- |
Source: Public Records
Mortgage History
| Date | Status | Borrower | Loan Amount |
|---|---|---|---|
| Open | Sashington Sasha | $291,000 |
Source: Public Records
Tax History Compared to Growth
Tax History
| Year | Tax Paid | Tax Assessment Tax Assessment Total Assessment is a certain percentage of the fair market value that is determined by local assessors to be the total taxable value of land and additions on the property. | Land | Improvement |
|---|---|---|---|---|
| 2024 | $3,700 | $81,590 | $4,830 | $76,760 |
| 2023 | $3,804 | $81,590 | $4,830 | $76,760 |
| 2022 | $1,824 | $33,570 | $2,630 | $30,940 |
| 2021 | $648 | $20,970 | $2,630 | $18,340 |
| 2020 | $4,037 | $20,970 | $2,630 | $18,340 |
| 2019 | $3,006 | $17,470 | $2,170 | $15,300 |
| 2018 | $907 | $17,470 | $2,170 | $15,300 |
| 2017 | $1,696 | $17,470 | $2,170 | $15,300 |
| 2016 | $1,681 | $17,290 | $3,640 | $13,650 |
| 2015 | $995 | $17,290 | $3,640 | $13,650 |
| 2014 | $536 | $17,290 | $3,640 | $13,650 |
| 2013 | $569 | $20,335 | $4,270 | $16,065 |
Source: Public Records
Map
Nearby Homes
- 87 N Warren Ave
- 104-106 N Hague Ave
- 118 N Ogden Ave
- 166 N Harris Ave
- 127 N Burgess Ave
- 65 S Hague Ave
- 78 N Burgess Ave
- 85 S Warren Ave
- 200-202 N Harris Ave
- 75 N Terrace Ave
- 66 N Burgess Ave
- 65 N Chase Ave
- 162 S Roys Ave
- 2710 Palmetto St
- 126 S Richardson Ave
- 184 N Roys Ave
- 121 N Terrace Ave
- 149 N Eureka Ave
- 57 S Eureka Ave
- 219 S Ogden Ave
- 42 N Harris Ave Unit 2
- 42-44 N Harris Ave Unit 4
- 38 N Harris Ave
- 38 N Harris Ave Unit 2
- 48 N Harris Ave
- 32 N Harris Ave Unit 34
- 60 N Harris Ave
- 26 N Harris Ave
- 45 N Warren Ave
- 47 N Warren Ave
- 39 N Warren Ave
- 35 N Warren Ave Unit 37
- 35-37 N Warren Ave Unit 2
- 41 N Harris Ave
- 39 N Harris Ave
- 57 N Warren Ave
- 31 N Warren Ave
- 23 N Warren Ave Unit 25
- 23 N Warren Ave Unit 23-25
- 63 N Warren Ave