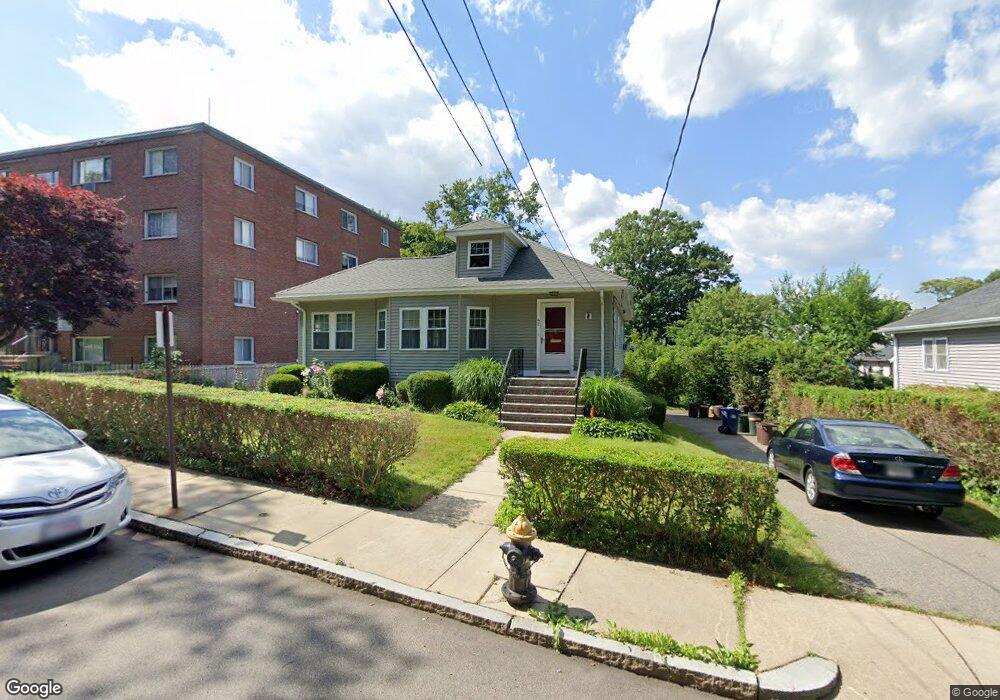
42 Nahant Ave Dorchester, MA 02122
Neponset-Port Norfolk NeighborhoodEstimated Value: $783,000 - $876,000
3
Beds
1
Bath
1,328
Sq Ft
$628/Sq Ft
Est. Value
About This Home
This home is located at 42 Nahant Ave, Dorchester, MA 02122 and is currently estimated at $834,496, approximately $628 per square foot. 42 Nahant Ave is a home located in Suffolk County with nearby schools including Neighborhood House Charter School and St Brendan School.
Ownership History
Date
Name
Owned For
Owner Type
Purchase Details
Closed on
Apr 3, 2024
Sold by
Sullivan Robert A
Bought by
Roberta A Sullivan Ft and Sullivan
Current Estimated Value
Purchase Details
Closed on
Dec 9, 2020
Sold by
Sullivan Roberta A
Bought by
Roberta A Sullivan Irt and Lawton
Create a Home Valuation Report for This Property
The Home Valuation Report is an in-depth analysis detailing your home's value as well as a comparison with similar homes in the area
Home Values in the Area
Average Home Value in this Area
Purchase History
| Date | Buyer | Sale Price | Title Company |
|---|---|---|---|
| Roberta A Sullivan Ft | -- | None Available | |
| Roberta A Sullivan Ft | -- | None Available | |
| Sullivan Roberta A | -- | None Available | |
| Sullivan Roberta A | -- | None Available | |
| Lawton Robert | -- | None Available | |
| Lawton Robert | -- | None Available | |
| Roberta A Sullivan Irt | -- | None Available | |
| Roberta A Sullivan Irt | -- | None Available |
Source: Public Records
Tax History Compared to Growth
Tax History
| Year | Tax Paid | Tax Assessment Tax Assessment Total Assessment is a certain percentage of the fair market value that is determined by local assessors to be the total taxable value of land and additions on the property. | Land | Improvement |
|---|---|---|---|---|
| 2025 | $8,438 | $728,700 | $323,800 | $404,900 |
| 2024 | $7,653 | $702,100 | $294,100 | $408,000 |
| 2023 | $7,045 | $656,000 | $274,800 | $381,200 |
| 2022 | $6,795 | $624,500 | $261,600 | $362,900 |
| 2021 | $6,294 | $589,900 | $254,000 | $335,900 |
| 2020 | $5,623 | $532,500 | $250,600 | $281,900 |
| 2019 | $5,197 | $493,100 | $192,900 | $300,200 |
| 2018 | $4,828 | $460,700 | $192,900 | $267,800 |
| 2017 | $4,645 | $438,600 | $192,900 | $245,700 |
| 2016 | $4,509 | $409,900 | $192,900 | $217,000 |
| 2015 | $4,143 | $342,100 | $166,500 | $175,600 |
| 2014 | $4,058 | $322,600 | $166,500 | $156,100 |
Source: Public Records
Map
Nearby Homes
- 701 Adams St Unit 9
- 51 Coffey St Unit 51C
- 56 Coffey St Unit 10
- 107 Minot St
- 223 Neponset Ave Unit 2
- 45 Chickatawbut St Unit 1
- 43 Chickatawbut St
- 140 Minot St
- 80 Beaumont St Unit 101
- 543 Adams St Unit 24
- 33 Westmoreland St
- 36 Mckone St Unit 2
- 36 Mckone St
- 36 Mckone St Unit 1
- 37 Westmoreland St
- 3 N Munroe Terrace
- 51 Florida St Unit 3
- 40 Westmoreland St Unit 8
- 80-84 Shepton St Unit 80-3
- 54 Msgr Patrick j Lydon Way
- 19 Humes Rd
- 36 Nahant Ave Unit 16
- 36 Nahant Ave Unit 15
- 36 Nahant Ave Unit 14
- 36 Nahant Ave Unit 13
- 36 Nahant Ave Unit 12
- 36 Nahant Ave Unit 11
- 36 Nahant Ave Unit 10
- 36 Nahant Ave Unit 8
- 36 Nahant Ave Unit 7
- 36 Nahant Ave Unit 5
- 36 Nahant Ave Unit 4
- 36 Nahant Ave Unit 3
- 36 Nahant Ave Unit 2
- 36 Nahant Ave Unit 1
- 36 Nahant Ave
- 46 Nahant Ave
- 15 Humes Rd
- 11 Humes Rd
- 7 Humes Rd