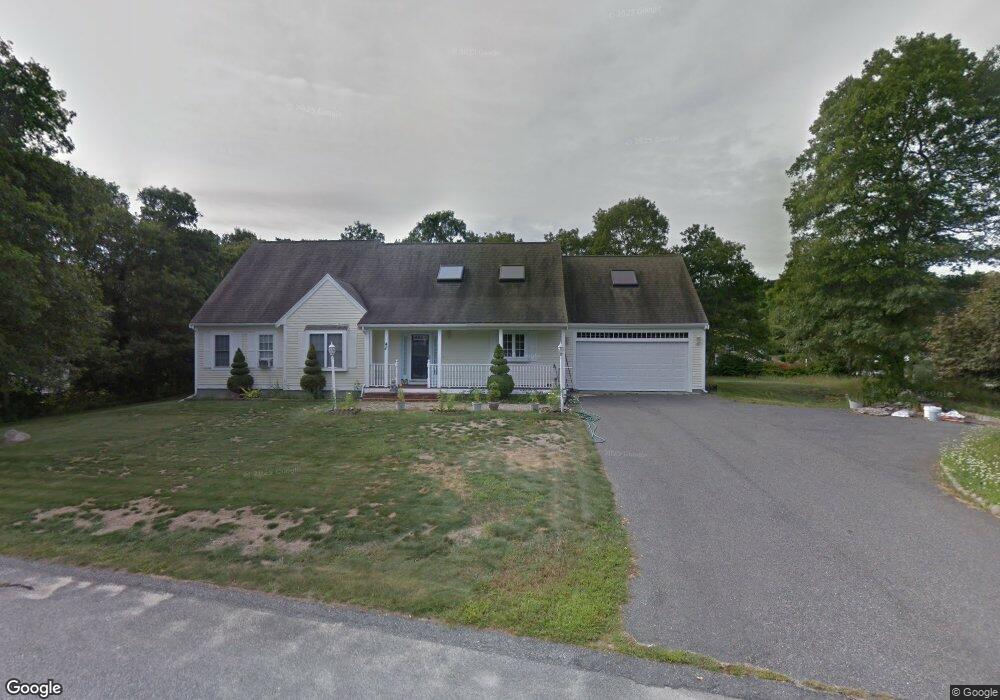
42 Noreast Dr Sagamore Beach, MA 02562
Estimated Value: $698,540 - $844,000
3
Beds
2
Baths
2,201
Sq Ft
$358/Sq Ft
Est. Value
About This Home
This home is located at 42 Noreast Dr, Sagamore Beach, MA 02562 and is currently estimated at $788,885, approximately $358 per square foot. 42 Noreast Dr is a home located in Barnstable County with nearby schools including Bourne High School, Bridgeview Montessori School, and New Testament Christian School.
Ownership History
Date
Name
Owned For
Owner Type
Purchase Details
Closed on
May 31, 2002
Sold by
M & A Rt
Bought by
Tran Thanh T and Tran Lanh T
Current Estimated Value
Home Financials for this Owner
Home Financials are based on the most recent Mortgage that was taken out on this home.
Original Mortgage
$230,000
Interest Rate
7%
Mortgage Type
Purchase Money Mortgage
Purchase Details
Closed on
Apr 12, 2001
Sold by
Hallett Burnham L and Hallett Joan M
Bought by
M&A Rt and Fitzgibbon Margaret M
Home Financials for this Owner
Home Financials are based on the most recent Mortgage that was taken out on this home.
Original Mortgage
$180,000
Interest Rate
6.97%
Mortgage Type
Purchase Money Mortgage
Create a Home Valuation Report for This Property
The Home Valuation Report is an in-depth analysis detailing your home's value as well as a comparison with similar homes in the area
Home Values in the Area
Average Home Value in this Area
Purchase History
| Date | Buyer | Sale Price | Title Company |
|---|---|---|---|
| Tran Thanh T | $330,000 | -- | |
| Tran Thanh T | $330,000 | -- | |
| M&A Rt | $97,000 | -- | |
| Fitzgibbon | $97,000 | -- |
Source: Public Records
Mortgage History
| Date | Status | Borrower | Loan Amount |
|---|---|---|---|
| Open | Fitzgibbon | $180,000 | |
| Closed | Fitzgibbon | $230,000 | |
| Previous Owner | Fitzgibbon | $180,000 |
Source: Public Records
Tax History Compared to Growth
Tax History
| Year | Tax Paid | Tax Assessment Tax Assessment Total Assessment is a certain percentage of the fair market value that is determined by local assessors to be the total taxable value of land and additions on the property. | Land | Improvement |
|---|---|---|---|---|
| 2025 | $4,654 | $595,900 | $205,600 | $390,300 |
| 2024 | $4,595 | $572,900 | $195,800 | $377,100 |
| 2023 | $4,510 | $511,900 | $173,300 | $338,600 |
| 2022 | $4,130 | $409,300 | $153,400 | $255,900 |
| 2021 | $1,437 | $375,900 | $139,600 | $236,300 |
| 2020 | $3,845 | $358,000 | $138,200 | $219,800 |
| 2019 | $1,299 | $348,500 | $138,200 | $210,300 |
| 2018 | $3,529 | $334,800 | $131,700 | $203,100 |
| 2017 | $1,294 | $331,400 | $130,400 | $201,000 |
| 2016 | $3,323 | $327,100 | $130,400 | $196,700 |
Source: Public Records
Map
Nearby Homes
- 16 Ocean Pines Dr Unit B
- 18 Ocean Pines Dr Unit A
- 4 Fieldwood Dr
- 4 Fieldwood Dr
- 5 Oakwood Dr
- 0 State Rd
- 10 Tecumseh Rd
- 368 Old Plymouth Rd
- 133 Phillips Rd
- 20 Brady Rd
- 42 Siasconset Dr
- 38 Siasconset Dr
- 5 Pocasset Rd
- 67 Phillips Rd
- 67 Phillips Rd
- 11 Village Green Dr Unit B
- 19 Oak Bluff Rd
- 29 Sheppard Rd
- 6 Louis Ave
- 33 Buzzards Bay Ave