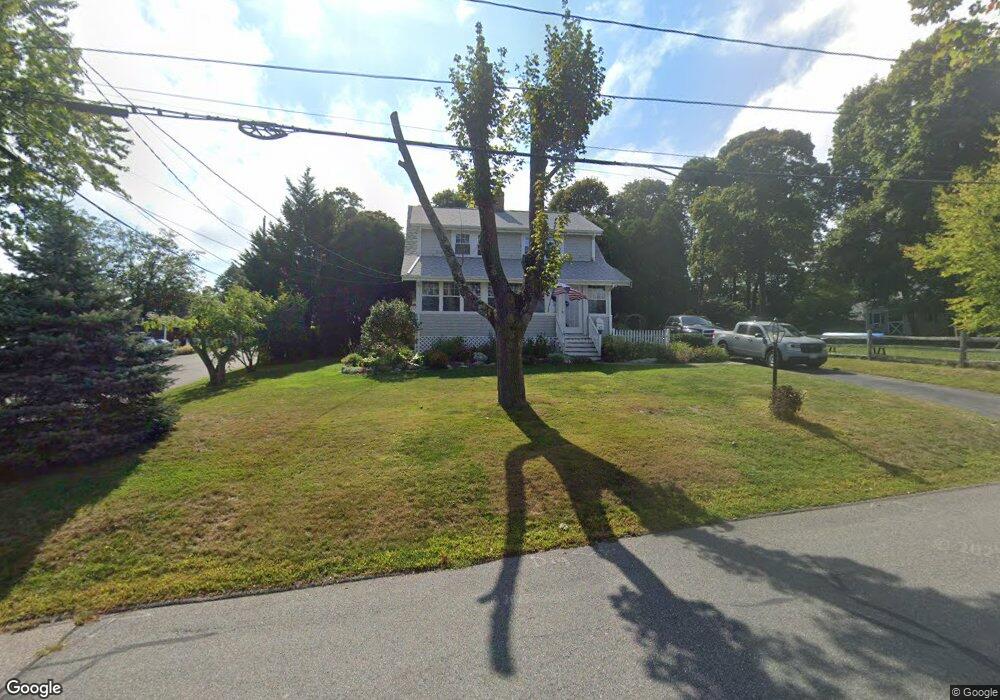
42 Norfolk Rd Cohasset, MA 02025
Estimated Value: $832,657 - $1,031,000
3
Beds
2
Baths
1,430
Sq Ft
$654/Sq Ft
Est. Value
About This Home
This home is located at 42 Norfolk Rd, Cohasset, MA 02025 and is currently estimated at $934,664, approximately $653 per square foot. 42 Norfolk Rd is a home located in Norfolk County with nearby schools including Joseph Osgood School, Deer Hill School, and Cohasset Middle School.
Ownership History
Date
Name
Owned For
Owner Type
Purchase Details
Closed on
Oct 15, 1996
Sold by
Harvey Ex Martha
Bought by
Donoghue Kevin F and Donoghue Martha K
Current Estimated Value
Home Financials for this Owner
Home Financials are based on the most recent Mortgage that was taken out on this home.
Original Mortgage
$168,000
Interest Rate
8.06%
Mortgage Type
Purchase Money Mortgage
Create a Home Valuation Report for This Property
The Home Valuation Report is an in-depth analysis detailing your home's value as well as a comparison with similar homes in the area
Home Values in the Area
Average Home Value in this Area
Purchase History
| Date | Buyer | Sale Price | Title Company |
|---|---|---|---|
| Donoghue Kevin F | $210,000 | -- | |
| Donoghue Kevin F | $210,000 | -- |
Source: Public Records
Mortgage History
| Date | Status | Borrower | Loan Amount |
|---|---|---|---|
| Open | Donoghue Kevin F | $100,000 | |
| Closed | Donoghue Kevin F | $168,000 |
Source: Public Records
Tax History
| Year | Tax Paid | Tax Assessment Tax Assessment Total Assessment is a certain percentage of the fair market value that is determined by local assessors to be the total taxable value of land and additions on the property. | Land | Improvement |
|---|---|---|---|---|
| 2025 | $7,557 | $652,600 | $431,200 | $221,400 |
| 2024 | $7,063 | $580,400 | $359,000 | $221,400 |
| 2023 | $6,680 | $566,100 | $345,400 | $220,700 |
| 2022 | $6,890 | $548,600 | $345,400 | $203,200 |
| 2021 | $6,871 | $526,900 | $345,400 | $181,500 |
| 2020 | $6,834 | $526,900 | $345,400 | $181,500 |
| 2019 | $5,628 | $436,300 | $254,800 | $181,500 |
| 2018 | $5,580 | $436,300 | $254,800 | $181,500 |
| 2017 | $5,279 | $404,200 | $242,600 | $161,600 |
| 2016 | $5,206 | $404,200 | $242,600 | $161,600 |
| 2015 | $5,137 | $404,200 | $242,600 | $161,600 |
| 2014 | $5,069 | $404,200 | $242,600 | $161,600 |
Source: Public Records
Map
Nearby Homes
- 101 Pond St
- 40 Pond St
- 46 Pond St
- 3 Brook St Unit A
- 147 S Main St
- 12 Tupelo Rd
- 171 S Main St
- 128 Elm St Unit 211
- 128 Elm St Unit 210
- 175 Sohier St
- 84 Elm St
- 66 Summer St
- 31 Chittenden Ln Unit 31
- 212 S Main St
- 87 Elm St Unit 216
- 87 Elm St Unit 319
- 50 Jerusalem Rd
- 98 Black Horse Ln
- 124 Elm St Unit 308
- 45 Hemlock Way
Your Personal Tour Guide
Ask me questions while you tour the home.