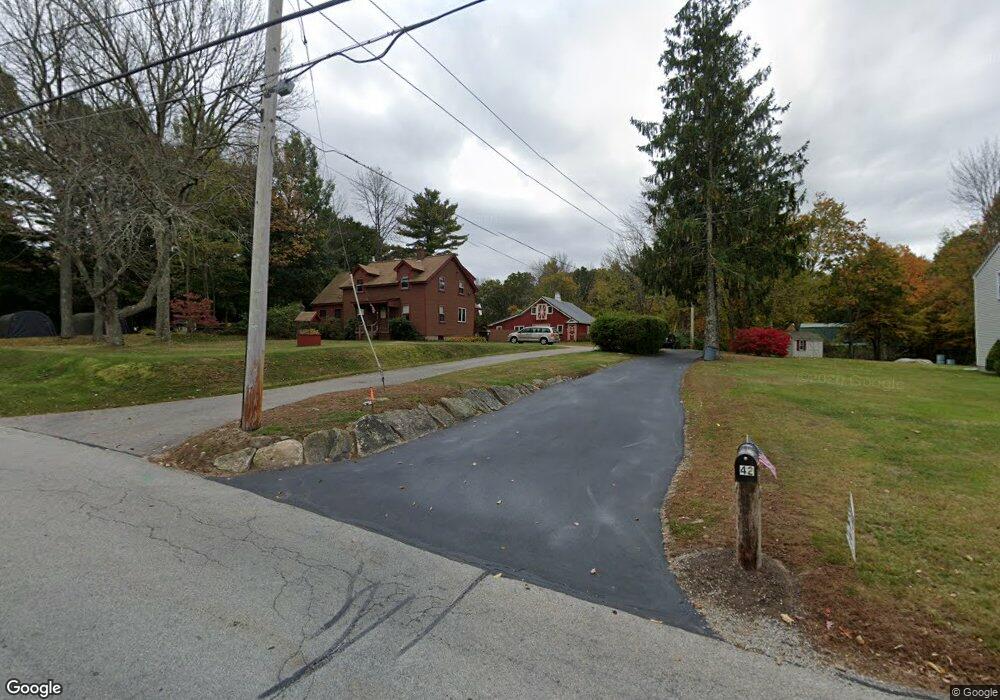
42 NW Main St Douglas, MA 01516
Estimated Value: $783,000 - $1,120,000
2
Beds
1
Bath
1,612
Sq Ft
$612/Sq Ft
Est. Value
About This Home
This home is located at 42 NW Main St, Douglas, MA 01516 and is currently estimated at $985,902, approximately $611 per square foot. 42 NW Main St is a home located in Worcester County with nearby schools including Douglas Primary School, Douglas Middle School, and Douglas High School.
Ownership History
Date
Name
Owned For
Owner Type
Purchase Details
Closed on
Feb 26, 1999
Sold by
Mandozzi Laurie and Mandozzi Linda
Bought by
Moran Timothy M and Moran Kristine
Current Estimated Value
Purchase Details
Closed on
Sep 20, 1996
Sold by
Cupka Michael
Bought by
Moran Timothy and Moran Kristine
Create a Home Valuation Report for This Property
The Home Valuation Report is an in-depth analysis detailing your home's value as well as a comparison with similar homes in the area
Home Values in the Area
Average Home Value in this Area
Purchase History
| Date | Buyer | Sale Price | Title Company |
|---|---|---|---|
| Moran Timothy M | $1,500 | -- | |
| Moran Timothy | $30,875 | -- |
Source: Public Records
Mortgage History
| Date | Status | Borrower | Loan Amount |
|---|---|---|---|
| Open | Moran Timothy | $151,640 | |
| Closed | Moran Timothy | $50,000 | |
| Open | Moran Timothy | $248,000 |
Source: Public Records
Tax History Compared to Growth
Tax History
| Year | Tax Paid | Tax Assessment Tax Assessment Total Assessment is a certain percentage of the fair market value that is determined by local assessors to be the total taxable value of land and additions on the property. | Land | Improvement |
|---|---|---|---|---|
| 2025 | $120 | $911,600 | $150,600 | $761,000 |
| 2024 | $11,808 | $873,400 | $136,900 | $736,500 |
| 2023 | $11,479 | $799,400 | $136,900 | $662,500 |
| 2022 | $12,394 | $758,500 | $132,400 | $626,100 |
| 2021 | $12,306 | $736,000 | $126,100 | $609,900 |
| 2020 | $11,986 | $705,900 | $126,100 | $579,800 |
| 2019 | $12,178 | $695,900 | $126,100 | $569,800 |
| 2018 | $10,929 | $680,100 | $126,100 | $554,000 |
| 2017 | $10,940 | $654,300 | $129,300 | $525,000 |
| 2016 | $10,585 | $629,300 | $129,300 | $500,000 |
| 2015 | $10,358 | $629,300 | $129,300 | $500,000 |
Source: Public Records
Map
Nearby Homes