42 Oakland St Westport, MA 02790
North Westport NeighborhoodEstimated Value: $404,000 - $487,000
2
Beds
--
Bath
1,159
Sq Ft
$380/Sq Ft
Est. Value
About This Home
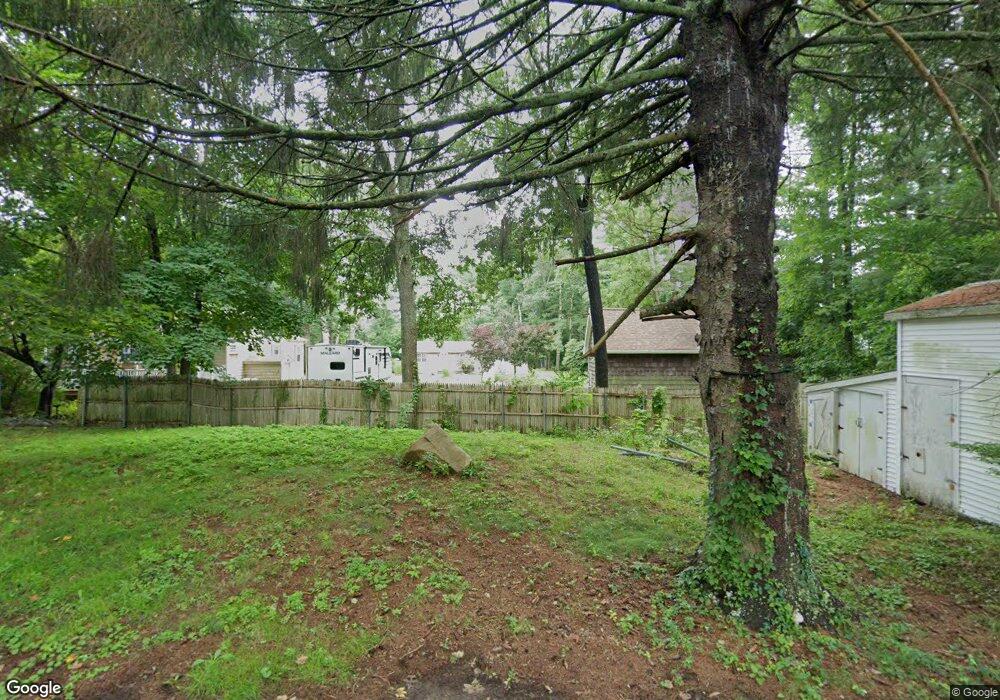
This home is located at 42 Oakland St, Westport, MA 02790 and is currently estimated at $440,349, approximately $379 per square foot. 42 Oakland St is a home located in Bristol County with nearby schools including Alice A. Macomber Primary School, Westport Elementary School, and Westport Middle-High School.
Ownership History
Date
Name
Owned For
Owner Type
Purchase Details
Closed on
Nov 3, 2016
Sold by
Mackie Jay and Mackie Joanne
Bought by
T Jay
Current Estimated Value
Purchase Details
Closed on
Apr 27, 2000
Sold by
Barreira James S
Bought by
Mackie Jay and Mackie Joanne
Home Financials for this Owner
Home Financials are based on the most recent Mortgage that was taken out on this home.
Original Mortgage
$112,500
Interest Rate
8.23%
Mortgage Type
Purchase Money Mortgage
Purchase Details
Closed on
Feb 3, 1995
Sold by
Mendrala Stanley
Bought by
Barreira James S
Create a Home Valuation Report for This Property
The Home Valuation Report is an in-depth analysis detailing your home's value as well as a comparison with similar homes in the area
Home Values in the Area
Average Home Value in this Area
Purchase History
| Date | Buyer | Sale Price | Title Company |
|---|---|---|---|
| T Jay | -- | -- | |
| Mackie Jay | $125,000 | -- | |
| Barreira James S | $10,000 | -- |
Source: Public Records
Mortgage History
| Date | Status | Borrower | Loan Amount |
|---|---|---|---|
| Previous Owner | Mackie Jay | $112,500 | |
| Previous Owner | Mackie Jay | $35,000 | |
| Previous Owner | Mackie Jay | $6,800 |
Source: Public Records
Tax History Compared to Growth
Tax History
| Year | Tax Paid | Tax Assessment Tax Assessment Total Assessment is a certain percentage of the fair market value that is determined by local assessors to be the total taxable value of land and additions on the property. | Land | Improvement |
|---|---|---|---|---|
| 2025 | $2,599 | $348,800 | $147,400 | $201,400 |
| 2024 | $2,592 | $335,300 | $136,600 | $198,700 |
| 2023 | $2,530 | $310,100 | $123,900 | $186,200 |
| 2022 | $2,296 | $275,900 | $117,700 | $158,200 |
| 2021 | $2,296 | $266,400 | $107,000 | $159,400 |
| 2020 | $2,164 | $256,700 | $97,300 | $159,400 |
| 2019 | $2,046 | $247,400 | $97,300 | $150,100 |
| 2018 | $1,451 | $177,600 | $84,900 | $92,700 |
| 2017 | $1,466 | $184,000 | $90,800 | $93,200 |
| 2016 | $1,395 | $176,400 | $86,100 | $90,300 |
| 2015 | $1,442 | $181,800 | $98,900 | $82,900 |
Source: Public Records
Map
Nearby Homes
- 16 S Berryman St
- 15 S Breault St
- 9 Kyle Jacob Rd
- 565 Highland Ave
- 27 Dias Ave
- 96 Forge Rd
- 116 Gifford Rd
- 29 Union Ave
- 20 Faulkner St
- 21 Evergreen St
- 55 Lakeside Ave
- 3 Roller Coaster Way Unit Lot 1
- 735 Reed Rd
- 818 Reed Rd
- 100 D Dr
- 461 Reed Rd
- 1276 Old Fall River Rd
- 4 Main Rd
- 19 Charles Joseph Dr
- 2 Donna Marie Dr