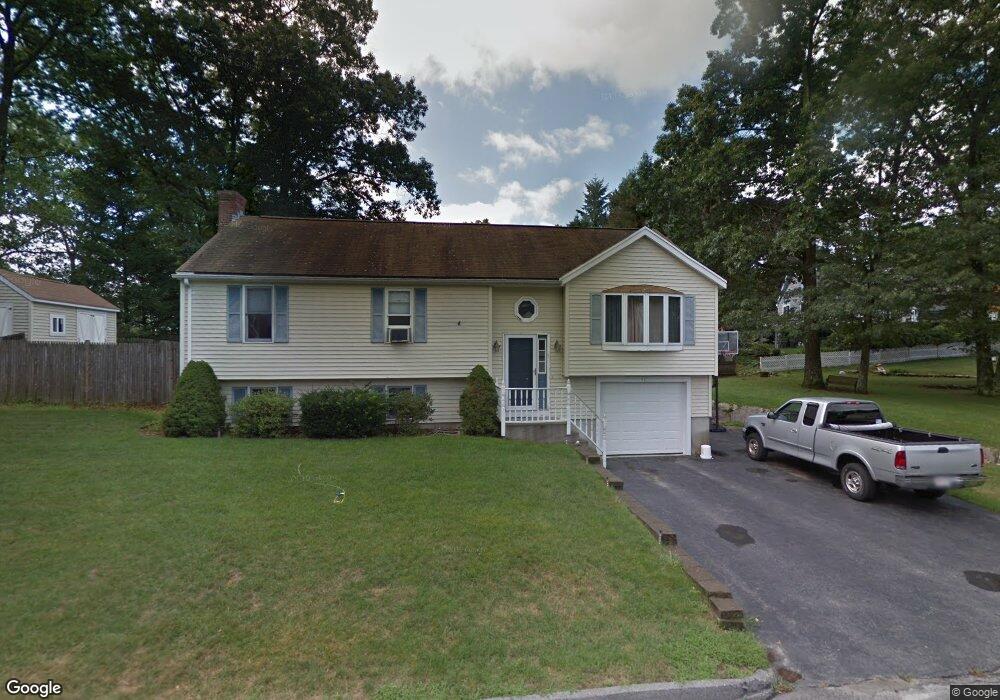
42 Old Cart Rd Auburn, MA 01501
Stoneville NeighborhoodEstimated Value: $471,000 - $547,000
3
Beds
3
Baths
1,241
Sq Ft
$414/Sq Ft
Est. Value
About This Home
This home is located at 42 Old Cart Rd, Auburn, MA 01501 and is currently estimated at $513,367, approximately $413 per square foot. 42 Old Cart Rd is a home located in Worcester County with nearby schools including Auburn Senior High School and Shrewsbury Montessori School - Auburn Campus.
Ownership History
Date
Name
Owned For
Owner Type
Purchase Details
Closed on
Feb 2, 1994
Sold by
Johnson Thomas
Bought by
Hynes Kenneth B and Hynes Susan
Current Estimated Value
Home Financials for this Owner
Home Financials are based on the most recent Mortgage that was taken out on this home.
Original Mortgage
$95,000
Interest Rate
7.12%
Mortgage Type
Purchase Money Mortgage
Create a Home Valuation Report for This Property
The Home Valuation Report is an in-depth analysis detailing your home's value as well as a comparison with similar homes in the area
Home Values in the Area
Average Home Value in this Area
Purchase History
| Date | Buyer | Sale Price | Title Company |
|---|---|---|---|
| Hynes Kenneth B | $120,000 | -- |
Source: Public Records
Mortgage History
| Date | Status | Borrower | Loan Amount |
|---|---|---|---|
| Open | Hynes Kenneth B | $50,000 | |
| Open | Hynes Kenneth B | $101,400 | |
| Closed | Hynes Kenneth B | $25,000 | |
| Closed | Hynes Kenneth B | $95,000 |
Source: Public Records
Tax History Compared to Growth
Tax History
| Year | Tax Paid | Tax Assessment Tax Assessment Total Assessment is a certain percentage of the fair market value that is determined by local assessors to be the total taxable value of land and additions on the property. | Land | Improvement |
|---|---|---|---|---|
| 2025 | $62 | $435,400 | $125,700 | $309,700 |
| 2024 | $6,153 | $412,100 | $119,500 | $292,600 |
| 2023 | $5,882 | $370,400 | $108,600 | $261,800 |
| 2022 | $5,487 | $326,200 | $108,600 | $217,600 |
| 2021 | $5,257 | $289,800 | $95,800 | $194,000 |
| 2020 | $5,211 | $289,800 | $95,800 | $194,000 |
| 2019 | $5,194 | $282,000 | $94,800 | $187,200 |
| 2018 | $5,113 | $277,300 | $88,700 | $188,600 |
| 2017 | $4,864 | $265,200 | $80,400 | $184,800 |
| 2016 | $4,770 | $263,700 | $84,500 | $179,200 |
| 2015 | $4,424 | $256,300 | $84,500 | $171,800 |
| 2014 | $4,295 | $248,400 | $80,400 | $168,000 |
Source: Public Records
Map
Nearby Homes