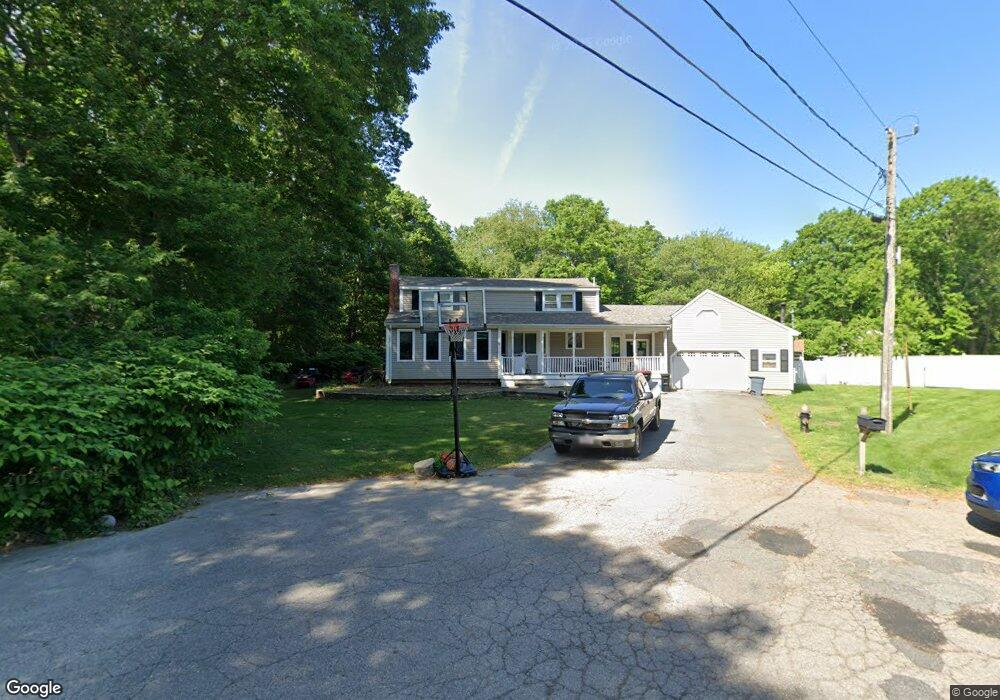
42 Olde Farm Ln Brockton, MA 02301
Clifton Heights NeighborhoodEstimated Value: $599,119 - $646,000
3
Beds
2
Baths
2,103
Sq Ft
$293/Sq Ft
Est. Value
About This Home
This home is located at 42 Olde Farm Ln, Brockton, MA 02301 and is currently estimated at $616,030, approximately $292 per square foot. 42 Olde Farm Ln is a home located in Plymouth County with nearby schools including Gilmore Elementary School, John F. Kennedy Elementary School, and Davis K-8 School.
Ownership History
Date
Name
Owned For
Owner Type
Purchase Details
Closed on
Jun 8, 2018
Sold by
Kennedy Jean M
Bought by
Delano Robert A
Current Estimated Value
Home Financials for this Owner
Home Financials are based on the most recent Mortgage that was taken out on this home.
Original Mortgage
$376,200
Outstanding Balance
$325,350
Interest Rate
4.5%
Mortgage Type
New Conventional
Estimated Equity
$290,680
Create a Home Valuation Report for This Property
The Home Valuation Report is an in-depth analysis detailing your home's value as well as a comparison with similar homes in the area
Home Values in the Area
Average Home Value in this Area
Purchase History
| Date | Buyer | Sale Price | Title Company |
|---|---|---|---|
| Delano Robert A | $396,000 | -- |
Source: Public Records
Mortgage History
| Date | Status | Borrower | Loan Amount |
|---|---|---|---|
| Open | Delano Robert A | $376,200 |
Source: Public Records
Tax History Compared to Growth
Tax History
| Year | Tax Paid | Tax Assessment Tax Assessment Total Assessment is a certain percentage of the fair market value that is determined by local assessors to be the total taxable value of land and additions on the property. | Land | Improvement |
|---|---|---|---|---|
| 2025 | $6,733 | $556,000 | $162,700 | $393,300 |
| 2024 | $6,213 | $516,900 | $162,700 | $354,200 |
| 2023 | $6,027 | $464,300 | $128,900 | $335,400 |
| 2022 | $5,813 | $416,100 | $117,700 | $298,400 |
| 2021 | $5,456 | $376,300 | $106,200 | $270,100 |
| 2020 | $5,905 | $389,800 | $101,800 | $288,000 |
| 2019 | $5,691 | $366,200 | $94,600 | $271,600 |
| 2018 | $5,189 | $323,100 | $94,600 | $228,500 |
| 2017 | $5,043 | $313,200 | $94,600 | $218,600 |
| 2016 | $5,238 | $301,700 | $91,200 | $210,500 |
| 2015 | $5,178 | $285,300 | $91,200 | $194,100 |
| 2014 | $5,011 | $276,400 | $91,200 | $185,200 |
Source: Public Records
Map
Nearby Homes