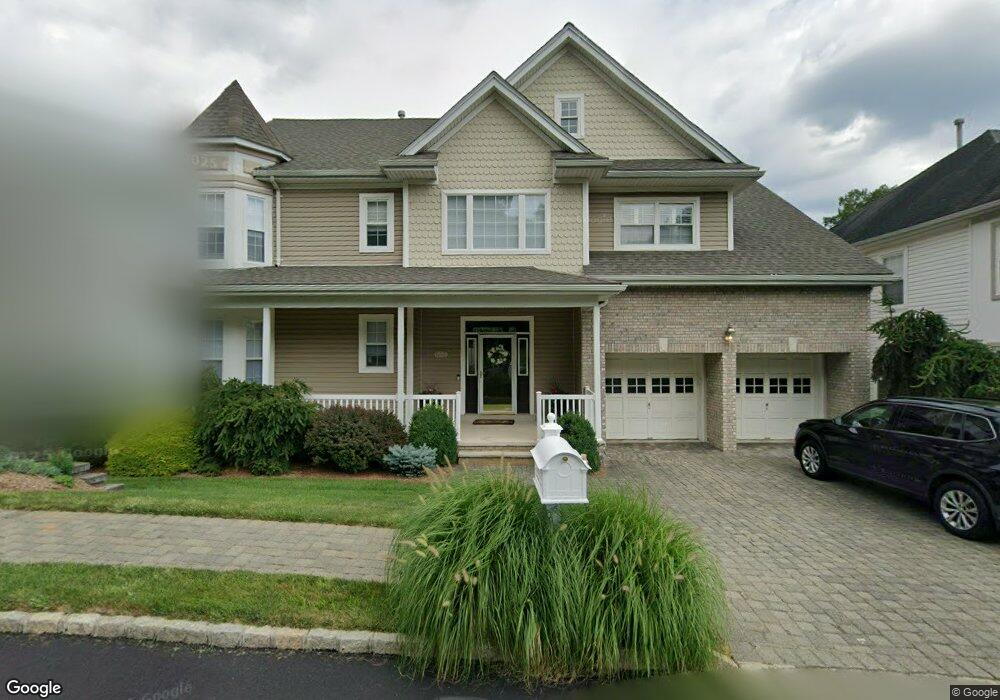
42 Overlook Ridge Oakland, NJ 07436
Estimated Value: $1,154,053 - $1,380,000
--
Bed
--
Bath
3,407
Sq Ft
$372/Sq Ft
Est. Value
About This Home
This home is located at 42 Overlook Ridge, Oakland, NJ 07436 and is currently estimated at $1,268,763, approximately $372 per square foot. 42 Overlook Ridge is a home located in Bergen County with nearby schools including Heights Elementary School, Valley Middle School, and Indian Hills High School.
Ownership History
Date
Name
Owned For
Owner Type
Purchase Details
Closed on
Oct 19, 2005
Sold by
Iannello Joseph
Bought by
Shelkin Christopher and Shelkin Carita
Current Estimated Value
Home Financials for this Owner
Home Financials are based on the most recent Mortgage that was taken out on this home.
Original Mortgage
$707,200
Interest Rate
6.34%
Purchase Details
Closed on
May 17, 2005
Sold by
Gephart Bruce
Bought by
Iannello Joseph and Iannello Marilyn
Home Financials for this Owner
Home Financials are based on the most recent Mortgage that was taken out on this home.
Original Mortgage
$720,000
Interest Rate
5.94%
Purchase Details
Closed on
Dec 7, 2001
Sold by
Baker Residential Lp
Bought by
Gephart Bruce and Gephart Cynthia
Home Financials for this Owner
Home Financials are based on the most recent Mortgage that was taken out on this home.
Original Mortgage
$330,000
Interest Rate
6.84%
Create a Home Valuation Report for This Property
The Home Valuation Report is an in-depth analysis detailing your home's value as well as a comparison with similar homes in the area
Home Values in the Area
Average Home Value in this Area
Purchase History
| Date | Buyer | Sale Price | Title Company |
|---|---|---|---|
| Shelkin Christopher | $884,000 | -- | |
| Iannello Joseph | $900,000 | -- | |
| Gephart Bruce | $582,130 | -- |
Source: Public Records
Mortgage History
| Date | Status | Borrower | Loan Amount |
|---|---|---|---|
| Previous Owner | Shelkin Christopher | $707,200 | |
| Previous Owner | Iannello Joseph | $720,000 | |
| Previous Owner | Gephart Bruce | $330,000 |
Source: Public Records
Tax History Compared to Growth
Tax History
| Year | Tax Paid | Tax Assessment Tax Assessment Total Assessment is a certain percentage of the fair market value that is determined by local assessors to be the total taxable value of land and additions on the property. | Land | Improvement |
|---|---|---|---|---|
| 2025 | $22,526 | $1,046,900 | $304,400 | $742,500 |
| 2024 | $22,273 | $979,400 | $273,800 | $705,600 |
| 2023 | $21,471 | $938,200 | $262,400 | $675,800 |
| 2022 | $21,471 | $912,900 | $256,000 | $656,900 |
| 2021 | $21,490 | $700,000 | $215,600 | $484,400 |
| 2020 | $20,993 | $700,000 | $215,600 | $484,400 |
| 2019 | $20,258 | $700,000 | $215,600 | $484,400 |
| 2018 | $19,831 | $700,000 | $215,600 | $484,400 |
| 2017 | $19,572 | $700,000 | $215,600 | $484,400 |
| 2016 | $20,604 | $757,500 | $215,600 | $541,900 |
| 2015 | $20,195 | $757,500 | $215,600 | $541,900 |
| 2014 | $19,778 | $757,500 | $215,600 | $541,900 |
Source: Public Records
Map
Nearby Homes
- 4 Point View
- 42 Hunters Run
- 65 Overlook Ridge
- 7 Valley Forge Rd
- 130 Deerhaven Rd
- 23 Chuckanutt Dr
- 632 Ramapo Valley Rd
- 29 Manito Ave
- 2 Rock Ledge
- 28 Minnehaha Blvd
- 83 Oneida Ave
- 12 Fordham Rd
- 509 Ramapo Valley Rd
- 22 Calumet Ave
- 737 Surrey Ln
- 11 Loyola Place
- 731 Surrey Ln
- 96 Roosevelt Blvd
- 39 Lovell Dr
- 37 Lakeshore Dr
- 40 Overlook Ridge
- 44 Overlook Ridge
- 38 Overlook Ridge
- 36 Overlook Ridge
- 2 Wisperingwoods
- 34 Overlook Ridge
- 32 Overlook Ridge
- 4 Whispering Woods
- 4 Wisperingwoods
- 43 Overlook Ridge
- 30 Overlook Ridge
- 6 Whispering Woods
- 45 Overlook Ridge
- 28 Overlook Ridge
- 6 Wisperingwoods
- 8 Wisperingwoods
- 26 Overlook Ridge
- 46 Overlook Ridge
- 24 Overlook Ridge
- 1 Point View