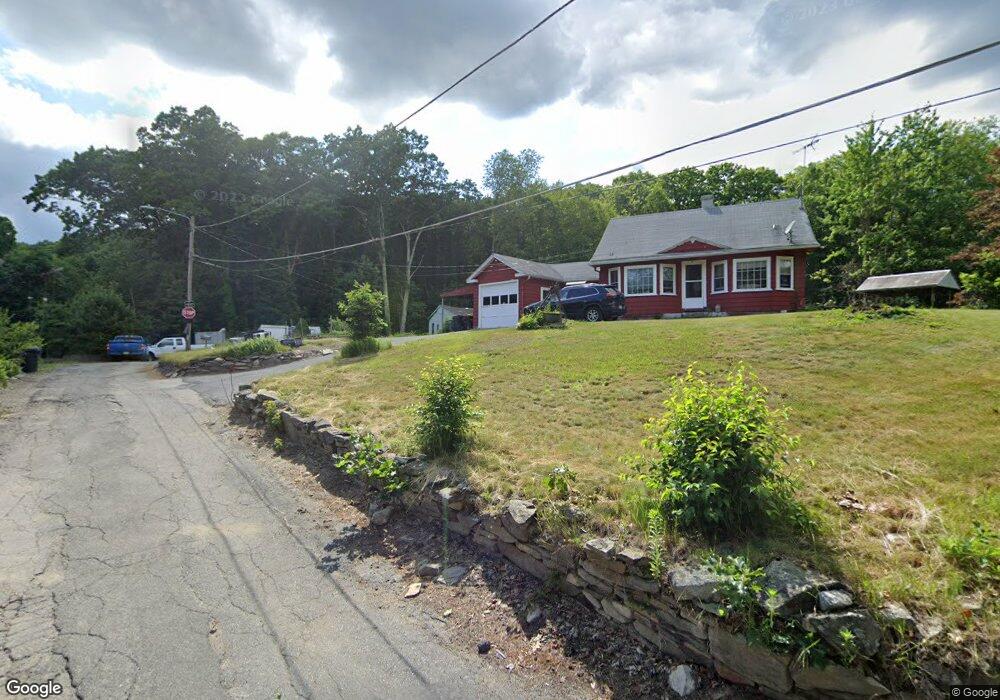
42 Pollier Way Auburn, MA 01501
Stoneville NeighborhoodEstimated Value: $298,000 - $412,000
3
Beds
2
Baths
1,025
Sq Ft
$347/Sq Ft
Est. Value
About This Home
This home is located at 42 Pollier Way, Auburn, MA 01501 and is currently estimated at $355,307, approximately $346 per square foot. 42 Pollier Way is a home located in Worcester County with nearby schools including Auburn Senior High School and Shrewsbury Montessori School - Auburn Campus.
Ownership History
Date
Name
Owned For
Owner Type
Purchase Details
Closed on
Sep 19, 2021
Sold by
Sokoloski David W and Sokoloski Donna M
Bought by
Gendenberg Paul
Current Estimated Value
Purchase Details
Closed on
Jul 9, 1997
Sold by
Gedenberg Ernest and Gedenberg Blanche
Bought by
Sokoloski David W and Sokoloski Donna M
Home Financials for this Owner
Home Financials are based on the most recent Mortgage that was taken out on this home.
Original Mortgage
$37,800
Interest Rate
7.86%
Mortgage Type
Purchase Money Mortgage
Create a Home Valuation Report for This Property
The Home Valuation Report is an in-depth analysis detailing your home's value as well as a comparison with similar homes in the area
Home Values in the Area
Average Home Value in this Area
Purchase History
| Date | Buyer | Sale Price | Title Company |
|---|---|---|---|
| Gendenberg Paul | $53,000 | None Available | |
| Sokoloski David W | $42,000 | -- |
Source: Public Records
Mortgage History
| Date | Status | Borrower | Loan Amount |
|---|---|---|---|
| Previous Owner | Sokoloski David W | $37,800 |
Source: Public Records
Tax History Compared to Growth
Tax History
| Year | Tax Paid | Tax Assessment Tax Assessment Total Assessment is a certain percentage of the fair market value that is determined by local assessors to be the total taxable value of land and additions on the property. | Land | Improvement |
|---|---|---|---|---|
| 2025 | $41 | $284,800 | $178,600 | $106,200 |
| 2024 | $4,046 | $271,000 | $171,900 | $99,100 |
| 2023 | $3,935 | $247,800 | $154,200 | $93,600 |
| 2022 | $3,855 | $229,200 | $154,200 | $75,000 |
| 2021 | $3,539 | $195,100 | $136,200 | $58,900 |
| 2020 | $3,497 | $194,500 | $136,200 | $58,300 |
| 2019 | $3,920 | $212,800 | $136,800 | $76,000 |
| 2018 | $3,655 | $198,200 | $127,900 | $70,300 |
| 2017 | $3,415 | $186,200 | $115,900 | $70,300 |
| 2016 | $3,345 | $184,900 | $119,500 | $65,400 |
| 2015 | $3,283 | $190,200 | $119,500 | $70,700 |
| 2014 | $3,290 | $190,300 | $113,900 | $76,400 |
Source: Public Records
Map
Nearby Homes