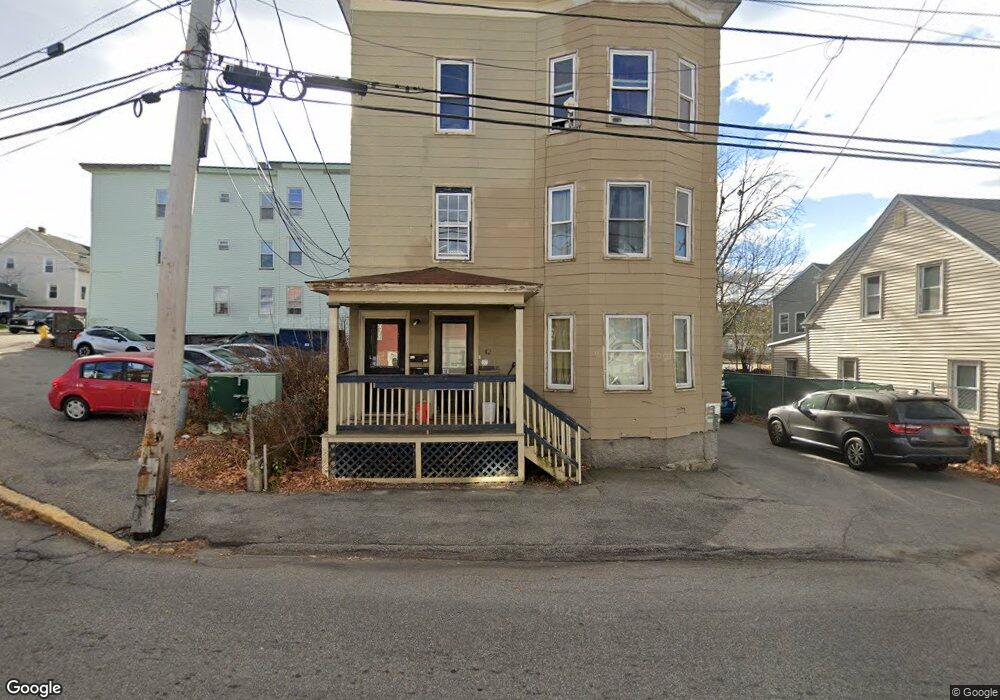
42 Pool St Biddeford, ME 04005
Downtown Biddeford NeighborhoodEstimated Value: $620,000 - $723,000
9
Beds
3
Baths
4,410
Sq Ft
$156/Sq Ft
Est. Value
About This Home
This home is located at 42 Pool St, Biddeford, ME 04005 and is currently estimated at $687,333, approximately $155 per square foot. 42 Pool St is a home located in York County with nearby schools including John F Kennedy Memorial School, Biddeford Primary School, and Biddeford Intermediate School.
Ownership History
Date
Name
Owned For
Owner Type
Purchase Details
Closed on
Mar 23, 2021
Sold by
Lavertu Edward L
Bought by
Lavertu Edward L and Lavertu Martha
Current Estimated Value
Home Financials for this Owner
Home Financials are based on the most recent Mortgage that was taken out on this home.
Original Mortgage
$193,500
Outstanding Balance
$171,969
Interest Rate
2.73%
Mortgage Type
Purchase Money Mortgage
Estimated Equity
$515,364
Purchase Details
Closed on
May 4, 2005
Sold by
Robillard Mary B and Robillard Dennis P
Bought by
Lavertu Ed
Home Financials for this Owner
Home Financials are based on the most recent Mortgage that was taken out on this home.
Original Mortgage
$160,000
Interest Rate
6.01%
Mortgage Type
Purchase Money Mortgage
Create a Home Valuation Report for This Property
The Home Valuation Report is an in-depth analysis detailing your home's value as well as a comparison with similar homes in the area
Home Values in the Area
Average Home Value in this Area
Purchase History
| Date | Buyer | Sale Price | Title Company |
|---|---|---|---|
| Lavertu Edward L | -- | None Available | |
| Lavertu Edward L | -- | None Available | |
| Lavertu Edward L | -- | None Available | |
| Lavertu Ed | -- | -- | |
| Lavertu Ed | -- | -- | |
| Lavertu Ed | -- | -- |
Source: Public Records
Mortgage History
| Date | Status | Borrower | Loan Amount |
|---|---|---|---|
| Open | Lavertu Edward L | $193,500 | |
| Closed | Lavertu Edward L | $193,500 | |
| Previous Owner | Lavertu Ed | $160,000 | |
| Previous Owner | Lavertu Ed | $30,000 |
Source: Public Records
Tax History
| Year | Tax Paid | Tax Assessment Tax Assessment Total Assessment is a certain percentage of the fair market value that is determined by local assessors to be the total taxable value of land and additions on the property. | Land | Improvement |
|---|---|---|---|---|
| 2025 | $4,180 | $279,800 | $116,500 | $163,300 |
| 2024 | $3,935 | $276,700 | $116,500 | $160,200 |
| 2023 | $3,600 | $274,400 | $116,500 | $157,900 |
| 2022 | $2,852 | $173,800 | $58,000 | $115,800 |
| 2021 | $2,705 | $148,400 | $47,400 | $101,000 |
| 2020 | $2,376 | $118,500 | $36,900 | $81,600 |
| 2019 | $2,368 | $118,500 | $36,900 | $81,600 |
| 2018 | $3,586 | $118,500 | $36,900 | $81,600 |
| 2017 | $5,247 | $109,400 | $36,900 | $72,500 |
| 2016 | $5,118 | $109,400 | $36,900 | $72,500 |
| 2015 | $2,130 | $109,400 | $36,900 | $72,500 |
| 2014 | $2,078 | $109,400 | $36,900 | $72,500 |
| 2013 | -- | $164,400 | $60,800 | $103,600 |
Source: Public Records
Map
Nearby Homes
- 36-38 Pool St
- 11 King St
- 109 Alfred St
- 5 Oak Place
- 84 Pike St
- 16 Hill St
- 155 Hill St
- 17 Granite St
- 2 Main St Unit 15-311
- 2 Main St Unit 17-407
- 2 Main St Unit 15-502
- 2 Main St Unit 18-415
- 2 Main St Unit 18-501
- 2 Main St Unit 15-511
- 2 Main St Unit 17-416
- 2 Main St Unit 18-421
- 2 Main St Unit 18-302
- 12 Kossuth St
- 4 Kossuth St
- 66 Graham St
Your Personal Tour Guide
Ask me questions while you tour the home.