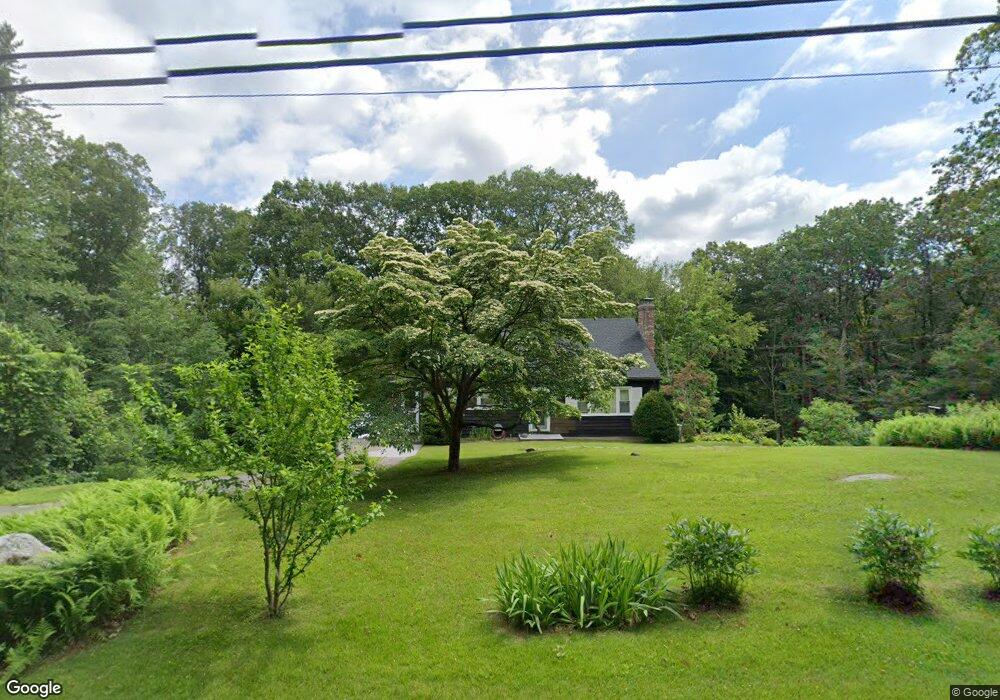
42 Ratlum Rd Barkhamsted, CT 06063
Estimated Value: $386,000 - $403,000
4
Beds
2
Baths
1,544
Sq Ft
$255/Sq Ft
Est. Value
About This Home
This home is located at 42 Ratlum Rd, Barkhamsted, CT 06063 and is currently estimated at $394,473, approximately $255 per square foot. 42 Ratlum Rd is a home located in Litchfield County with nearby schools including Barkhamsted Elementary School, Northwestern Regional Middle School, and Northwestern Regional High School.
Ownership History
Date
Name
Owned For
Owner Type
Purchase Details
Closed on
Jul 2, 1993
Sold by
Hubbard Van R
Bought by
Warner James E and Burke Elizabeth M
Current Estimated Value
Home Financials for this Owner
Home Financials are based on the most recent Mortgage that was taken out on this home.
Original Mortgage
$121,000
Interest Rate
7.46%
Mortgage Type
Unknown
Create a Home Valuation Report for This Property
The Home Valuation Report is an in-depth analysis detailing your home's value as well as a comparison with similar homes in the area
Home Values in the Area
Average Home Value in this Area
Purchase History
| Date | Buyer | Sale Price | Title Company |
|---|---|---|---|
| Warner James E | $127,650 | -- |
Source: Public Records
Mortgage History
| Date | Status | Borrower | Loan Amount |
|---|---|---|---|
| Closed | Warner James E | $77,000 | |
| Closed | Warner James E | $97,000 | |
| Closed | Warner James E | $121,000 | |
| Previous Owner | Warner James E | $25,000 |
Source: Public Records
Tax History Compared to Growth
Tax History
| Year | Tax Paid | Tax Assessment Tax Assessment Total Assessment is a certain percentage of the fair market value that is determined by local assessors to be the total taxable value of land and additions on the property. | Land | Improvement |
|---|---|---|---|---|
| 2025 | $5,541 | $218,400 | $45,110 | $173,290 |
| 2024 | $5,591 | $218,400 | $45,110 | $173,290 |
| 2023 | $4,921 | $145,000 | $45,980 | $99,020 |
| 2022 | $4,850 | $145,000 | $45,980 | $99,020 |
| 2021 | $4,803 | $144,640 | $45,980 | $98,660 |
| 2020 | $4,691 | $144,640 | $45,980 | $98,660 |
| 2019 | $4,504 | $138,030 | $45,980 | $92,050 |
| 2018 | $4,184 | $132,750 | $43,790 | $88,960 |
| 2017 | $4,115 | $132,750 | $43,790 | $88,960 |
| 2016 | $3,985 | $132,750 | $43,790 | $88,960 |
| 2015 | $3,900 | $132,750 | $43,790 | $88,960 |
| 2014 | $3,850 | $132,750 | $43,790 | $88,960 |
Source: Public Records
Map
Nearby Homes
- 19 Ratlum Mountain Rd
- 33 N Canton Rd
- 36 Briarwood Rd
- 715 Cherry Brook Rd
- 175 Case St
- 27 Ridge Rd
- 86 Case St
- 11 Timbercrest Dr
- 537 Cherry Brook Rd
- 35 Rustle Meadow Ln
- 28 Fuller Rd
- 21 Legeyt Rd
- 20 Edgerton Rd
- 68 Case St
- 116 Holcomb Hill Rd
- 1 Woodridge Dr
- 103 New Hartford Rd
- 15 Bunker Hill Rd
- 391 Cherry Brook Rd
- 22 Wickett St