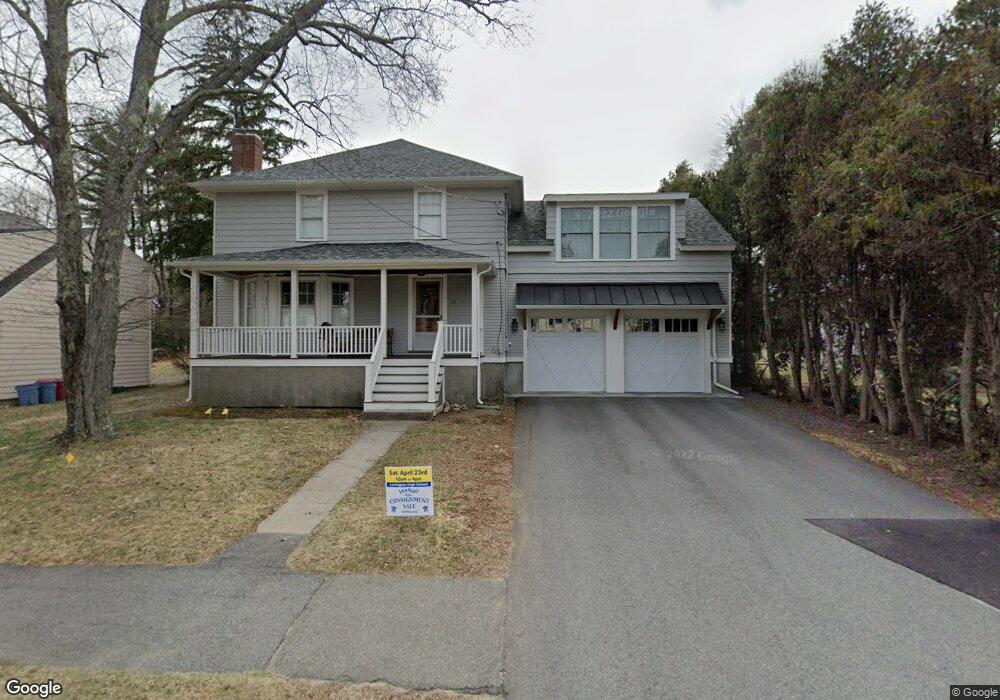
42 Reed St Lexington, MA 02421
North Lexington NeighborhoodEstimated Value: $1,224,000 - $2,020,000
4
Beds
4
Baths
2,783
Sq Ft
$591/Sq Ft
Est. Value
About This Home
This home is located at 42 Reed St, Lexington, MA 02421 and is currently estimated at $1,643,714, approximately $590 per square foot. 42 Reed St is a home located in Middlesex County with nearby schools including Joseph Estabrook Elementary School, William Diamond Middle School, and Lexington High School.
Ownership History
Date
Name
Owned For
Owner Type
Purchase Details
Closed on
Jan 3, 2003
Sold by
Banks Gary P and Banks Nancy H
Bought by
Applegate John and Applegate Collura-Applegate M
Current Estimated Value
Home Financials for this Owner
Home Financials are based on the most recent Mortgage that was taken out on this home.
Original Mortgage
$392,000
Outstanding Balance
$167,963
Interest Rate
6.08%
Mortgage Type
Purchase Money Mortgage
Estimated Equity
$1,475,751
Create a Home Valuation Report for This Property
The Home Valuation Report is an in-depth analysis detailing your home's value as well as a comparison with similar homes in the area
Home Values in the Area
Average Home Value in this Area
Purchase History
| Date | Buyer | Sale Price | Title Company |
|---|---|---|---|
| Applegate John | $490,000 | -- |
Source: Public Records
Mortgage History
| Date | Status | Borrower | Loan Amount |
|---|---|---|---|
| Open | Applegate John | $392,000 |
Source: Public Records
Tax History Compared to Growth
Tax History
| Year | Tax Paid | Tax Assessment Tax Assessment Total Assessment is a certain percentage of the fair market value that is determined by local assessors to be the total taxable value of land and additions on the property. | Land | Improvement |
|---|---|---|---|---|
| 2025 | $16,474 | $1,347,000 | $654,000 | $693,000 |
| 2024 | $15,876 | $1,296,000 | $623,000 | $673,000 |
| 2023 | $14,430 | $1,110,000 | $567,000 | $543,000 |
| 2022 | $13,869 | $1,005,000 | $515,000 | $490,000 |
| 2021 | $14,406 | $947,000 | $491,000 | $456,000 |
| 2020 | $6,385 | $965,000 | $491,000 | $474,000 |
| 2019 | $12,948 | $917,000 | $467,000 | $450,000 |
| 2018 | $12,684 | $887,000 | $445,000 | $442,000 |
| 2017 | $9,839 | $679,000 | $410,000 | $269,000 |
| 2016 | $8,220 | $563,000 | $391,000 | $172,000 |
| 2015 | $7,802 | $525,000 | $355,000 | $170,000 |
| 2014 | $7,600 | $490,000 | $316,000 | $174,000 |
Source: Public Records
Map
Nearby Homes
- 24 Vaille Ave
- 18 Hill St
- 17 Hamilton Rd
- 103 N Hancock St
- 93 Bedford St Unit 201
- 93 Bedford St Unit 308
- 93 Bedford St Unit 101
- 22 Burlington St
- 30 Burlington St
- 10 Preston Rd
- 3a Nowers Rd
- 7 Henderson Rd
- 92 Hill St
- 37 Freemont St
- 21 Balfour St
- 46 Asbury St
- 45 Hancock St
- 18 Greenwood St
- 12 Coolidge Ave
- 25 Flintlock Rd