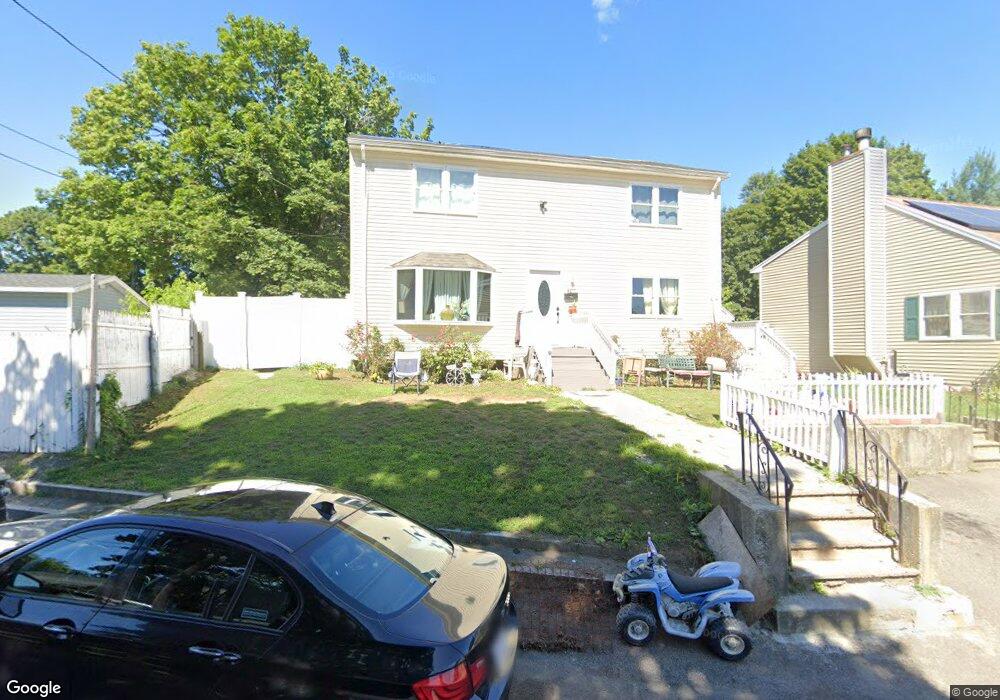
42 River St Brockton, MA 02302
Estimated Value: $521,000 - $608,000
3
Beds
1
Bath
2,094
Sq Ft
$269/Sq Ft
Est. Value
About This Home
This home is located at 42 River St, Brockton, MA 02302 and is currently estimated at $563,934, approximately $269 per square foot. 42 River St is a home located in Plymouth County with nearby schools including Brookfield Elementary School, Mary E. Baker Elementary School, and Downey Elementary School.
Ownership History
Date
Name
Owned For
Owner Type
Purchase Details
Closed on
Dec 2, 2013
Sold by
Murphy Leo P and Murphy Ruth
Bought by
Murphy Marcia C
Current Estimated Value
Home Financials for this Owner
Home Financials are based on the most recent Mortgage that was taken out on this home.
Original Mortgage
$53,685
Outstanding Balance
$40,062
Interest Rate
4.17%
Estimated Equity
$523,872
Purchase Details
Closed on
Jul 1, 1998
Sold by
Zirpolo Sharon L
Bought by
Murphy Leo P and Murphy Marcia C
Purchase Details
Closed on
May 1, 1997
Sold by
Wr Rlty Inc
Bought by
Zirpolo Sharon L
Purchase Details
Closed on
Apr 13, 1994
Sold by
Eden Rt
Bought by
Wr Rlty Inc
Purchase Details
Closed on
Mar 28, 1991
Sold by
Putnam Stephen G and Putnam Sharon L
Bought by
Eden Rt
Create a Home Valuation Report for This Property
The Home Valuation Report is an in-depth analysis detailing your home's value as well as a comparison with similar homes in the area
Purchase History
| Date | Buyer | Sale Price | Title Company |
|---|---|---|---|
| Murphy Marcia C | -- | -- | |
| Murphy Leo P | $75,900 | -- | |
| Zirpolo Sharon L | $75,000 | -- | |
| Wr Rlty Inc | $75,000 | -- | |
| Eden Rt | $105,000 | -- |
Source: Public Records
Mortgage History
| Date | Status | Borrower | Loan Amount |
|---|---|---|---|
| Open | Murphy Marcia C | $53,685 | |
| Previous Owner | Eden Rt | $35,350 | |
| Previous Owner | Eden Rt | $63,000 | |
| Previous Owner | Eden Rt | $50,000 |
Source: Public Records
Tax History
| Year | Tax Paid | Tax Assessment Tax Assessment Total Assessment is a certain percentage of the fair market value that is determined by local assessors to be the total taxable value of land and additions on the property. | Land | Improvement |
|---|---|---|---|---|
| 2025 | $5,624 | $464,400 | $140,100 | $324,300 |
| 2024 | $5,179 | $430,900 | $140,100 | $290,800 |
| 2023 | $5,431 | $418,400 | $104,600 | $313,800 |
| 2022 | $4,971 | $355,800 | $95,100 | $260,700 |
| 2021 | $4,431 | $305,600 | $79,000 | $226,600 |
| 2020 | $4,657 | $307,400 | $74,000 | $233,400 |
| 2019 | $4,603 | $296,200 | $72,200 | $224,000 |
| 2018 | $4,312 | $268,500 | $72,200 | $196,300 |
| 2017 | $3,848 | $239,000 | $72,200 | $166,800 |
| 2016 | $3,887 | $223,900 | $69,900 | $154,000 |
| 2015 | $3,398 | $187,200 | $69,900 | $117,300 |
| 2014 | $3,390 | $187,000 | $69,900 | $117,100 |
Source: Public Records
Map
Nearby Homes
- 14 Emmet St
- 24 E Ashland St
- 30 Elliot St
- 0 Prospect St
- 560 N Montello St
- 35 Huntington St
- 39 Huntington St
- 146 Court St Unit 108
- 69 Beacon Park
- 97 Huntington St
- 271 Ames St
- 29 Saint Casimir Ave
- 90 Cherry St
- 115 Ames St
- 18 Walnut St
- 7 Main St Unit 203
- 7 Main St Unit 102
- 112 Ames St
- 13 Standish St
- 0 Vine St
Your Personal Tour Guide
Ask me questions while you tour the home.