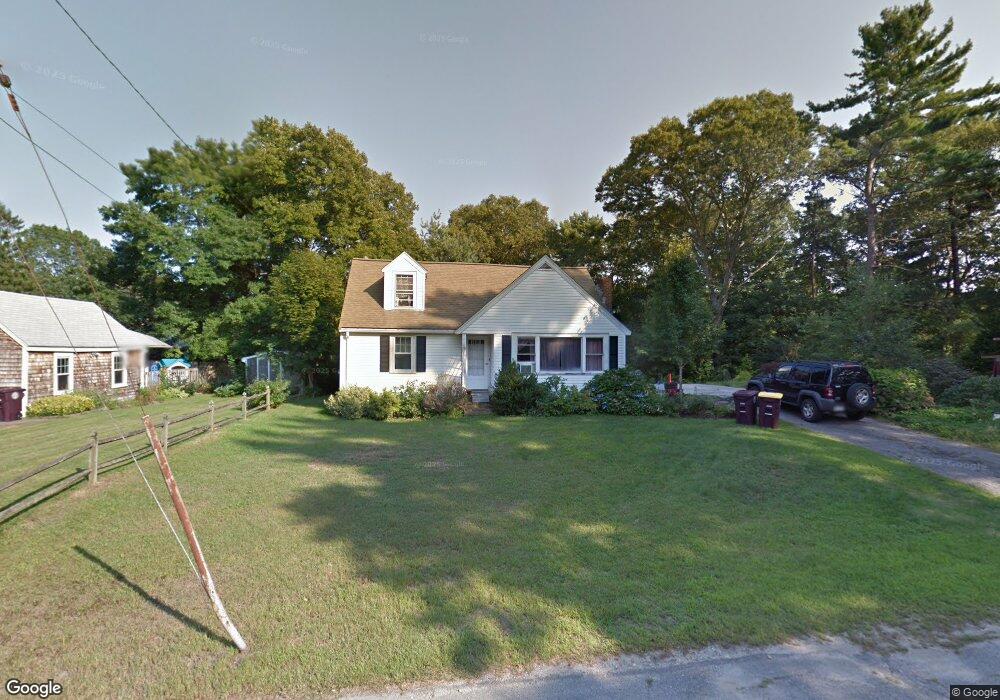
42 Roland Rd South Weymouth, MA 02190
South Weymouth NeighborhoodEstimated Value: $569,000 - $665,000
3
Beds
1
Bath
1,356
Sq Ft
$458/Sq Ft
Est. Value
About This Home
This home is located at 42 Roland Rd, South Weymouth, MA 02190 and is currently estimated at $620,757, approximately $457 per square foot. 42 Roland Rd is a home located in Norfolk County with nearby schools including Thomas V Nash, Abigail Adams Middle School, and Weymouth Middle School Chapman.
Ownership History
Date
Name
Owned For
Owner Type
Purchase Details
Closed on
Mar 7, 2024
Sold by
Savage Christina L and Willey James E
Bought by
Willey Ft and Willey
Current Estimated Value
Purchase Details
Closed on
Sep 1, 1998
Sold by
Anderson Robert A
Bought by
Anderson Robert A
Home Financials for this Owner
Home Financials are based on the most recent Mortgage that was taken out on this home.
Original Mortgage
$102,400
Interest Rate
6.9%
Mortgage Type
Purchase Money Mortgage
Create a Home Valuation Report for This Property
The Home Valuation Report is an in-depth analysis detailing your home's value as well as a comparison with similar homes in the area
Home Values in the Area
Average Home Value in this Area
Purchase History
| Date | Buyer | Sale Price | Title Company |
|---|---|---|---|
| Willey Ft | -- | None Available | |
| Anderson Robert A | $128,000 | -- |
Source: Public Records
Mortgage History
| Date | Status | Borrower | Loan Amount |
|---|---|---|---|
| Previous Owner | Anderson Robert A | $102,400 |
Source: Public Records
Tax History Compared to Growth
Tax History
| Year | Tax Paid | Tax Assessment Tax Assessment Total Assessment is a certain percentage of the fair market value that is determined by local assessors to be the total taxable value of land and additions on the property. | Land | Improvement |
|---|---|---|---|---|
| 2025 | $4,896 | $484,800 | $220,900 | $263,900 |
| 2024 | $4,849 | $472,200 | $210,400 | $261,800 |
| 2023 | $4,755 | $455,000 | $212,500 | $242,500 |
| 2022 | $4,746 | $414,100 | $196,800 | $217,300 |
| 2021 | $4,482 | $381,800 | $196,800 | $185,000 |
| 2020 | $4,275 | $358,600 | $196,800 | $161,800 |
| 2019 | $4,234 | $349,300 | $189,200 | $160,100 |
| 2018 | $4,108 | $328,600 | $180,200 | $148,400 |
| 2017 | $4,010 | $313,000 | $171,700 | $141,300 |
| 2016 | $3,909 | $305,400 | $165,100 | $140,300 |
| 2015 | $3,777 | $292,800 | $165,100 | $127,700 |
| 2014 | $3,554 | $267,200 | $153,600 | $113,600 |
Source: Public Records
Map
Nearby Homes
- 211 Randolph St
- 193 Randolph St
- 120 Randolph St
- 50 Hollis St
- 68 Massapoag St Unit 7
- 11 Woodcrest Ct Unit 5
- 10 Woodcrest Ct Unit 4
- 24 Fisher Rd
- 18 Fountain Ln Unit 2
- 7 Woodcrest Ct Unit 4
- 354 Tilden Commons Ln
- 8 Woodcrest Ct Unit 4
- 175 Tyson Commons Ln
- 16 Jay Rd
- 20 Wilbur St
- 308 Forest St
- 134 Tyson Commons Ln
- 55 Greentree Ln Unit 19
- 60 Greentree Ln Unit 38
- 30 Bradford Commons Ln