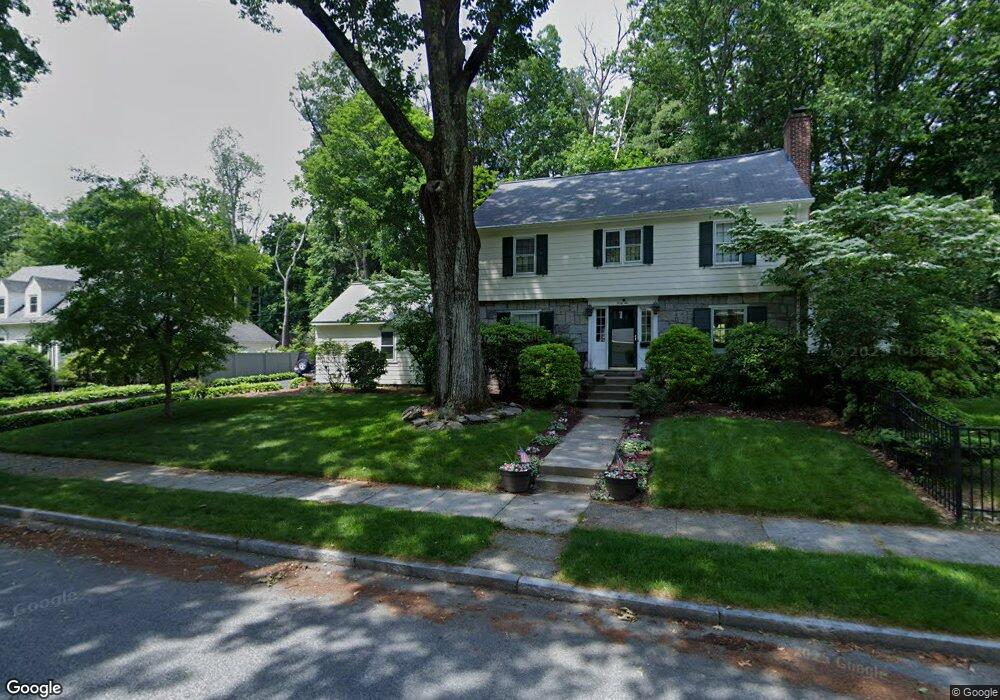
42 S Flagg St Worcester, MA 01602
Newton Square NeighborhoodEstimated Value: $591,000 - $625,000
4
Beds
2
Baths
2,616
Sq Ft
$234/Sq Ft
Est. Value
About This Home
This home is located at 42 S Flagg St, Worcester, MA 01602 and is currently estimated at $612,280, approximately $234 per square foot. 42 S Flagg St is a home located in Worcester County with nearby schools including Chandler Magnet, Jacob Hiatt Magnet School, and Midland Street.
Ownership History
Date
Name
Owned For
Owner Type
Purchase Details
Closed on
Jul 30, 1999
Sold by
Lockbaum Gordon C and Lockbaum Linda D
Bought by
Bushe Harry S
Current Estimated Value
Purchase Details
Closed on
Nov 21, 1997
Sold by
Murphy Timothy and Murphy Elizabeth A
Bought by
Lockbaum Gordon C and Lockbaum Linda D
Purchase Details
Closed on
Apr 22, 1992
Sold by
Rudnick Richard A and Trugman Sheila
Bought by
Murphy Timothy and Murphy Elizabeth
Create a Home Valuation Report for This Property
The Home Valuation Report is an in-depth analysis detailing your home's value as well as a comparison with similar homes in the area
Home Values in the Area
Average Home Value in this Area
Purchase History
| Date | Buyer | Sale Price | Title Company |
|---|---|---|---|
| Bushe Harry S | $266,600 | -- | |
| Lockbaum Gordon C | $185,000 | -- | |
| Murphy Timothy | $172,500 | -- |
Source: Public Records
Mortgage History
| Date | Status | Borrower | Loan Amount |
|---|---|---|---|
| Open | Murphy Timothy | $272,000 | |
| Closed | Murphy Timothy | $289,200 |
Source: Public Records
Tax History
| Year | Tax Paid | Tax Assessment Tax Assessment Total Assessment is a certain percentage of the fair market value that is determined by local assessors to be the total taxable value of land and additions on the property. | Land | Improvement |
|---|---|---|---|---|
| 2025 | $7,446 | $564,500 | $120,000 | $444,500 |
| 2024 | $7,248 | $527,100 | $120,000 | $407,100 |
| 2023 | $6,999 | $488,100 | $104,400 | $383,700 |
| 2022 | $6,504 | $427,600 | $83,600 | $344,000 |
| 2021 | $6,349 | $390,000 | $67,000 | $323,000 |
| 2020 | $6,113 | $359,600 | $66,900 | $292,700 |
| 2019 | $6,133 | $340,700 | $60,600 | $280,100 |
| 2018 | $6,061 | $320,500 | $60,600 | $259,900 |
| 2017 | $6,033 | $313,900 | $60,600 | $253,300 |
| 2016 | $6,158 | $298,800 | $46,100 | $252,700 |
| 2015 | $5,997 | $298,800 | $46,100 | $252,700 |
| 2014 | $5,864 | $300,100 | $46,100 | $254,000 |
Source: Public Records
Map
Nearby Homes
- 73 Moore Ave
- 19 Kenilworth Rd
- 31 Lenox St
- 16 Sherwood Rd
- 12 Cardinal Rd
- 18 Hadwen Ln
- 26 Westbrook Rd
- 24 Hadwen Rd
- 47R Yarnie Unit 3A
- 47R Yarnie Unit 1B
- 47R Yarnie Unit 2B
- 47R Yarnie Unit 4B
- 47R Yarnie Unit 8B
- 47R Yarnie Unit 5A
- 47R Yarnie Unit 6B
- 47R Yarnie Unit 4A
- 47R Yarnie Unit 1A
- 47R Yarnie Unit 9
- 47R Yarnie Unit 8A
- 47R Yarnie Unit 6A
Your Personal Tour Guide
Ask me questions while you tour the home.