R
Seller's Agent in 2020
Robin Perschel
Feiner Real Estate

Estimated Value: $3,184,000 - $4,903,178
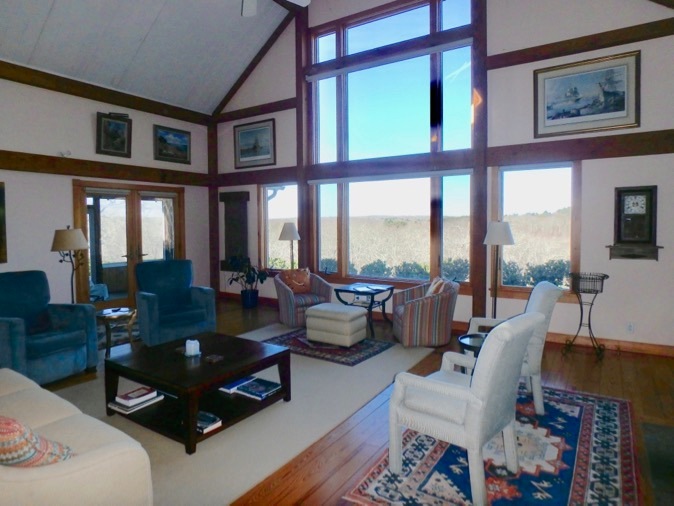
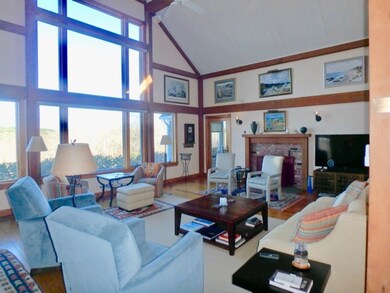
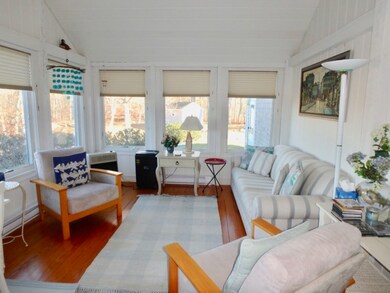
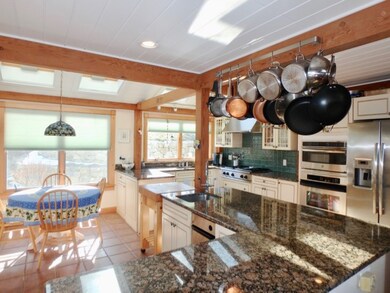
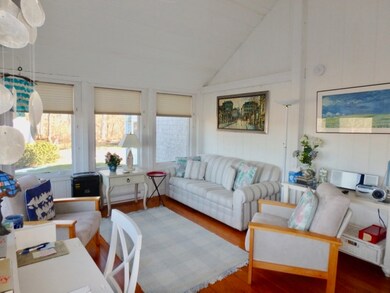
Spectacular post and beam home set among rolling Chilmark hills. This house sits beautifully on the land and is tucked into two knolls. The pastoral views are endless. Gaze out the large window wall and watch the magnificent sunset views. Or gather in one of the two porches for entertaining a crowd. Enjoy the cathedral ceiling, large windows and fireplace in the living which then flows seamlessly to the open dining and kitchen area. The master bedroom suite is on the first floor complete with a comfortable library. Several generous bedrooms are on the second floor with room for extra guests in the office or loft area. This home has top of the line heating and cooling systems and is supplemented by a vast array of solar panels. Newly painted garage and garage floor with room for two cars is right off the entryway. Association tennis is right down the street. This is an incredible opportunity to surround yourself with privacy and beauty and to enjoy the wonderful Chilmark Beaches.
Last Agent to Sell the Property
Robin Perschel
Feiner Real Estate Listed on: 01/08/2020
Last Buyer's Agent
Carol Brush
Muskeget Associates
| Date | Buyer | Sale Price | Title Company |
|---|---|---|---|
| 42 South Ridge Road Nt | $1,789,125 | None Available | |
| Williams Richard C | $138,360 | -- |
| Date | Status | Borrower | Loan Amount |
|---|---|---|---|
| Open | 42 South Ridge Road Nt | $1,430,000 | |
| Previous Owner | Williams Richard C | $110,688 |
| Date | Event | Price | List to Sale | Price per Sq Ft |
|---|---|---|---|---|
| 05/18/2020 05/18/20 | Sold | $1,789,125 | -3.3% | $453 / Sq Ft |
| 01/30/2020 01/30/20 | Pending | -- | -- | -- |
| 01/08/2020 01/08/20 | For Sale | $1,850,000 | -- | $468 / Sq Ft |
| Year | Tax Paid | Tax Assessment Tax Assessment Total Assessment is a certain percentage of the fair market value that is determined by local assessors to be the total taxable value of land and additions on the property. | Land | Improvement |
|---|---|---|---|---|
| 2025 | $6,150 | $2,733,500 | $914,800 | $1,818,700 |
| 2024 | $5,317 | $2,508,000 | $795,500 | $1,712,500 |
| 2023 | $5,089 | $1,935,000 | $611,900 | $1,323,100 |
| 2022 | $5,908 | $2,095,100 | $611,900 | $1,483,200 |
| 2021 | $5,474 | $1,881,100 | $611,900 | $1,269,200 |
| 2020 | $3,923 | $1,371,600 | $599,900 | $771,700 |
| 2019 | $3,799 | $1,319,200 | $599,900 | $719,300 |
| 2018 | $3,628 | $1,319,200 | $599,900 | $719,300 |
| 2017 | $3,520 | $1,313,400 | $599,900 | $713,500 |
| 2016 | $3,543 | $1,307,500 | $599,900 | $707,600 |
| 2015 | $3,460 | $1,315,600 | $599,900 | $715,700 |
| 2014 | $3,000 | $1,209,800 | $612,000 | $597,800 |
R
Seller's Agent in 2020
Robin Perschel
Feiner Real Estate
C
Buyer's Agent in 2020
Carol Brush
Muskeget Associates
Source: LINK (Vineyard)
MLS Number: 36139
APN: CHIL-000012-000000-000057
Ask me questions while you tour the home.