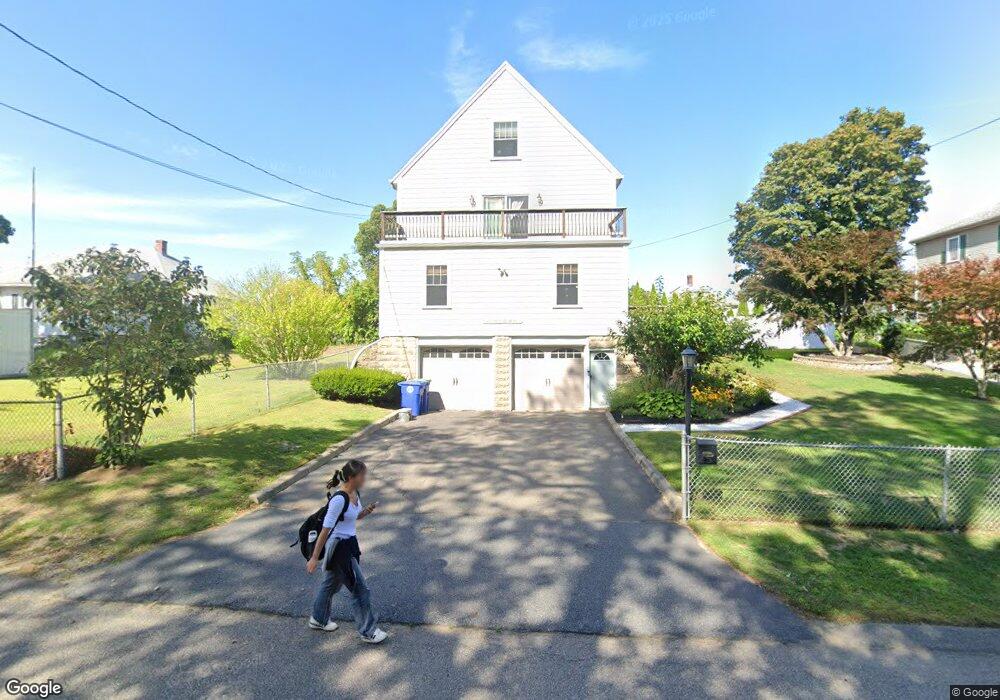
42 Sagamore St Braintree, MA 02184
South Braintree NeighborhoodEstimated Value: $705,000 - $880,000
2
Beds
1
Bath
1,118
Sq Ft
$686/Sq Ft
Est. Value
About This Home
This home is located at 42 Sagamore St, Braintree, MA 02184 and is currently estimated at $766,543, approximately $685 per square foot. 42 Sagamore St is a home located in Norfolk County with nearby schools including Braintree High School, Thayer Academy, and South Shore SDA School.
Ownership History
Date
Name
Owned For
Owner Type
Purchase Details
Closed on
Feb 28, 2005
Sold by
A F Porter Jr Rt and Porter Stephen T
Bought by
Murray Brendan and Stirrat Kim M
Current Estimated Value
Home Financials for this Owner
Home Financials are based on the most recent Mortgage that was taken out on this home.
Original Mortgage
$299,250
Outstanding Balance
$152,916
Interest Rate
5.73%
Mortgage Type
Purchase Money Mortgage
Estimated Equity
$613,627
Create a Home Valuation Report for This Property
The Home Valuation Report is an in-depth analysis detailing your home's value as well as a comparison with similar homes in the area
Home Values in the Area
Average Home Value in this Area
Purchase History
| Date | Buyer | Sale Price | Title Company |
|---|---|---|---|
| Murray Brendan | $315,000 | -- |
Source: Public Records
Mortgage History
| Date | Status | Borrower | Loan Amount |
|---|---|---|---|
| Open | Murray Brendan | $299,250 |
Source: Public Records
Tax History Compared to Growth
Tax History
| Year | Tax Paid | Tax Assessment Tax Assessment Total Assessment is a certain percentage of the fair market value that is determined by local assessors to be the total taxable value of land and additions on the property. | Land | Improvement |
|---|---|---|---|---|
| 2025 | $6,808 | $682,200 | $336,700 | $345,500 |
| 2024 | $6,205 | $654,500 | $314,000 | $340,500 |
| 2023 | $5,893 | $603,800 | $282,100 | $321,700 |
| 2022 | $5,736 | $576,500 | $254,800 | $321,700 |
| 2021 | $5,304 | $533,100 | $230,200 | $302,900 |
| 2020 | $4,920 | $499,000 | $209,300 | $289,700 |
| 2019 | $4,750 | $470,800 | $200,200 | $270,600 |
| 2018 | $4,651 | $441,300 | $182,000 | $259,300 |
| 2017 | $4,481 | $417,200 | $172,900 | $244,300 |
| 2016 | $4,167 | $379,500 | $145,600 | $233,900 |
| 2015 | $4,088 | $369,300 | $143,800 | $225,500 |
| 2014 | $3,877 | $339,500 | $131,000 | $208,500 |
Source: Public Records
Map
Nearby Homes
- 414 John Mahar Hwy Unit 402
- 418 John Mahar Hwy Unit 408
- 428 John Mahar Hwy Unit 301
- 61 Grove St
- 605 Middle St Unit 38
- 6 Franklin St
- 117 Amherst Rd
- 972 Liberty St
- 298 Lisle St
- 115 Richard Rd
- 30 Thetford Ave
- 184 Richard Rd
- 432 Grove St
- 7 Carter Rd
- 441 Grove St
- 124 Louise Rd
- 491 Washington St Unit 1
- 37 Monatiquot Ave
- 501 Commerce Dr Unit 2310
- 501 Commerce Dr Unit 1111
- 48 Sagamore St
- 62 Fountain St
- 39 Columbus Ave
- 45 Columbus Ave
- 54 Sagamore St
- 56 Fountain St
- 45 Sagamore St
- 49 Sagamore St
- 49 Columbus Ave
- 37 Sagamore St
- 33 Sagamore St
- 56 Sagamore St
- 53 Sagamore St
- 57 Columbus Ave
- 57 Sagamore St
- 0 Columbus Ave
- 40 Columbus Ave
- 44 Columbus Ave
- 67 Fountain St
- 71 Fountain St