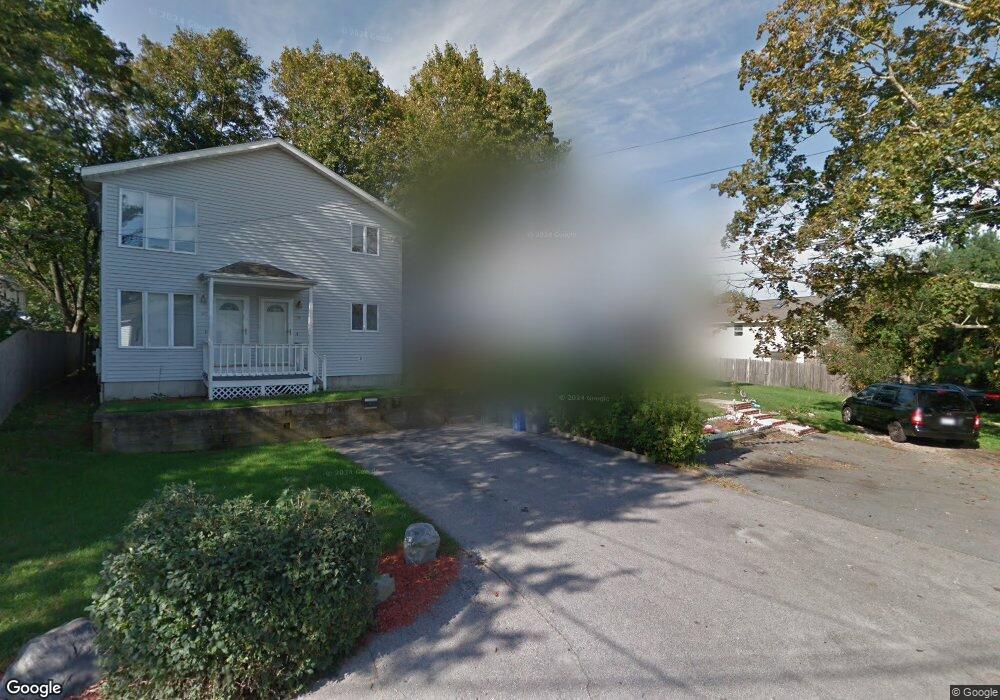
42 Seton St Providence, RI 02909
Hartford NeighborhoodEstimated Value: $437,000 - $620,000
4
Beds
4
Baths
1,872
Sq Ft
$284/Sq Ft
Est. Value
About This Home
This home is located at 42 Seton St, Providence, RI 02909 and is currently estimated at $531,236, approximately $283 per square foot. 42 Seton St is a home located in Providence County with nearby schools including Achievement First Promesa, Achievement First Providence Mayoral Academy Elementary School, and Achievement First Providence Mayoral Academy Elementary.
Ownership History
Date
Name
Owned For
Owner Type
Purchase Details
Closed on
Jul 30, 2002
Sold by
Peixoto Manuel V and Peixoto Deborah L
Bought by
Lora Yacaira E
Current Estimated Value
Home Financials for this Owner
Home Financials are based on the most recent Mortgage that was taken out on this home.
Original Mortgage
$117,800
Outstanding Balance
$50,009
Interest Rate
6.73%
Mortgage Type
Purchase Money Mortgage
Estimated Equity
$481,227
Create a Home Valuation Report for This Property
The Home Valuation Report is an in-depth analysis detailing your home's value as well as a comparison with similar homes in the area
Home Values in the Area
Average Home Value in this Area
Purchase History
| Date | Buyer | Sale Price | Title Company |
|---|---|---|---|
| Lora Yacaira E | $124,000 | -- |
Source: Public Records
Mortgage History
| Date | Status | Borrower | Loan Amount |
|---|---|---|---|
| Open | Lora Yacaira E | $55,000 | |
| Open | Lora Yacaira E | $117,800 | |
| Closed | Lora Yacaira E | $7,500 |
Source: Public Records
Tax History
| Year | Tax Paid | Tax Assessment Tax Assessment Total Assessment is a certain percentage of the fair market value that is determined by local assessors to be the total taxable value of land and additions on the property. | Land | Improvement |
|---|---|---|---|---|
| 2025 | $6,908 | $493,400 | $136,000 | $357,400 |
| 2024 | $6,445 | $351,200 | $86,000 | $265,200 |
| 2023 | $6,445 | $351,200 | $86,000 | $265,200 |
| 2022 | $6,251 | $351,200 | $86,000 | $265,200 |
| 2021 | $5,452 | $222,000 | $48,800 | $173,200 |
| 2020 | $5,452 | $222,000 | $48,800 | $173,200 |
| 2019 | $5,452 | $222,000 | $48,800 | $173,200 |
| 2018 | $5,037 | $157,600 | $41,600 | $116,000 |
| 2017 | $5,037 | $157,600 | $41,600 | $116,000 |
| 2016 | $5,037 | $157,600 | $41,600 | $116,000 |
| 2015 | $4,439 | $134,100 | $41,600 | $92,500 |
| 2014 | -- | $150,700 | $41,600 | $109,100 |
| 2013 | -- | $150,700 | $41,600 | $109,100 |
Source: Public Records
Map
Nearby Homes
- 60 Ophelia St
- 10 Mott St
- 231 Lowell Ave
- 102 Ophelia St
- 665 Plainfield St
- 166 Lowell Ave
- 0 Orchard St Unit 1396400
- 0 Orchard St Unit 1400488
- 162 Merino St
- 15 Melissa St
- 18 Crowninshield St
- 240 Eastwood Ave
- 33 Harding Ave
- 29 Matson Ave Unit 35
- 129 Glenbridge Ave
- 140 Cleveland St
- 68 Murray St
- 173 Whittier Ave
- 649 Union Ave
- 33 Prudence Ave
- 40 Seton St
- 38 Seton St
- 12 Burchard St
- 177 Killingly St
- 185 Killingly St
- 173 Killingly St
- 189 Killingly St
- 169 Killingly St
- 49 Springfield St
- 47 Springfield St
- 47 Springfield St
- 195 Killingly St
- 165 Killingly St
- 35 Springfield St
- 154 Killingly St
- 203 Killingly St
- 208 Killingly St
- 159 Killingly St
- 16 Ophelia St
- 10 Ophelia St
Your Personal Tour Guide
Ask me questions while you tour the home.