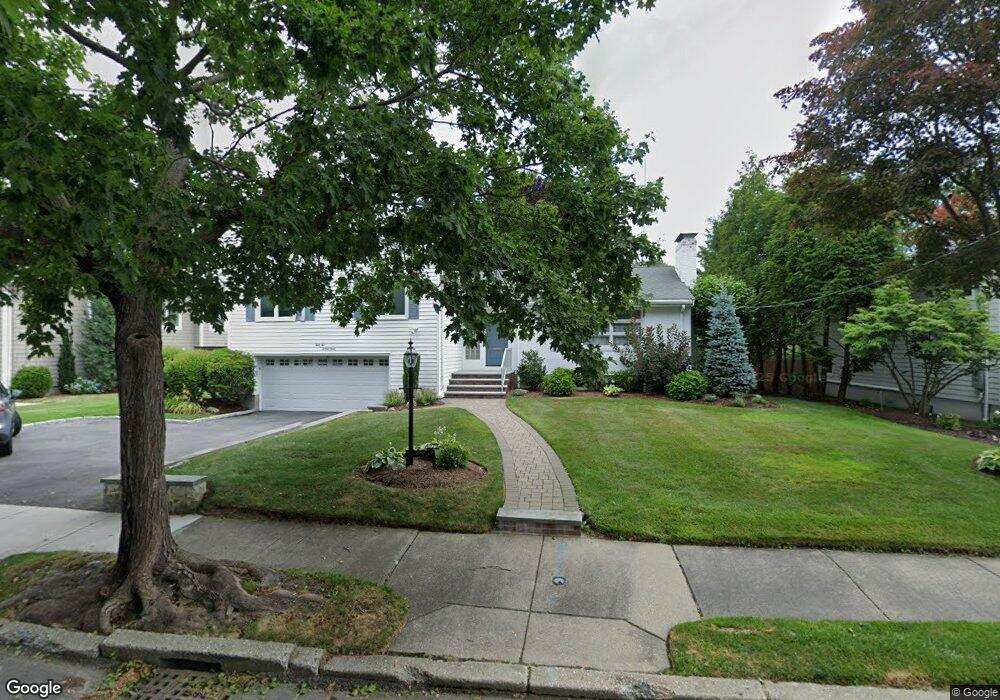
42 Sevland Rd Newton Center, MA 02459
Oak Hill NeighborhoodEstimated Value: $1,660,000 - $1,822,000
3
Beds
4
Baths
2,136
Sq Ft
$817/Sq Ft
Est. Value
About This Home
This home is located at 42 Sevland Rd, Newton Center, MA 02459 and is currently estimated at $1,745,428, approximately $817 per square foot. 42 Sevland Rd is a home located in Middlesex County with nearby schools including Memorial Spaulding Elementary School, Oak Hill Middle School, and Newton South High School.
Ownership History
Date
Name
Owned For
Owner Type
Purchase Details
Closed on
Oct 4, 1993
Sold by
Mintz Arthur G and Mintz Sylvia
Bought by
Barnett Richard E and Barnett Laura P
Current Estimated Value
Home Financials for this Owner
Home Financials are based on the most recent Mortgage that was taken out on this home.
Original Mortgage
$240,000
Interest Rate
7%
Mortgage Type
Purchase Money Mortgage
Create a Home Valuation Report for This Property
The Home Valuation Report is an in-depth analysis detailing your home's value as well as a comparison with similar homes in the area
Home Values in the Area
Average Home Value in this Area
Purchase History
| Date | Buyer | Sale Price | Title Company |
|---|---|---|---|
| Barnett Richard E | $389,550 | -- |
Source: Public Records
Mortgage History
| Date | Status | Borrower | Loan Amount |
|---|---|---|---|
| Closed | Barnett Richard E | $240,000 |
Source: Public Records
Tax History Compared to Growth
Tax History
| Year | Tax Paid | Tax Assessment Tax Assessment Total Assessment is a certain percentage of the fair market value that is determined by local assessors to be the total taxable value of land and additions on the property. | Land | Improvement |
|---|---|---|---|---|
| 2025 | $16,154 | $1,648,400 | $1,198,800 | $449,600 |
| 2024 | $15,620 | $1,600,400 | $1,163,900 | $436,500 |
| 2023 | $14,901 | $1,463,800 | $903,500 | $560,300 |
| 2022 | $14,259 | $1,355,400 | $836,600 | $518,800 |
| 2021 | $13,759 | $1,278,700 | $789,200 | $489,500 |
| 2020 | $13,350 | $1,278,700 | $789,200 | $489,500 |
| 2019 | $12,974 | $1,241,500 | $766,200 | $475,300 |
| 2018 | $12,475 | $1,153,000 | $701,500 | $451,500 |
| 2017 | $12,095 | $1,087,700 | $661,800 | $425,900 |
| 2016 | $11,568 | $1,016,500 | $618,500 | $398,000 |
| 2015 | $11,030 | $950,000 | $578,000 | $372,000 |
Source: Public Records
Map
Nearby Homes
- 59 Deborah Rd
- 41 Juniper Ln
- 56 Cynthia Rd
- 135 Hartman Rd
- 63 Drumlin Rd
- 65 Levbert Rd
- 44 Lovett Rd
- 58 Country Club Rd
- 21 Lovett Rd
- 36 Ober Rd
- 136 Dudley Rd
- 70 Pond Brook Rd
- 14 Rolling Ln
- 79 Florence St Unit 600S
- 79 Florence St Unit 402S
- 80 Louise Rd Unit 82
- 109 Harwich Rd
- 38 Tanglewood Rd
- 85 Dudley Rd
- 35 Haynes Rd