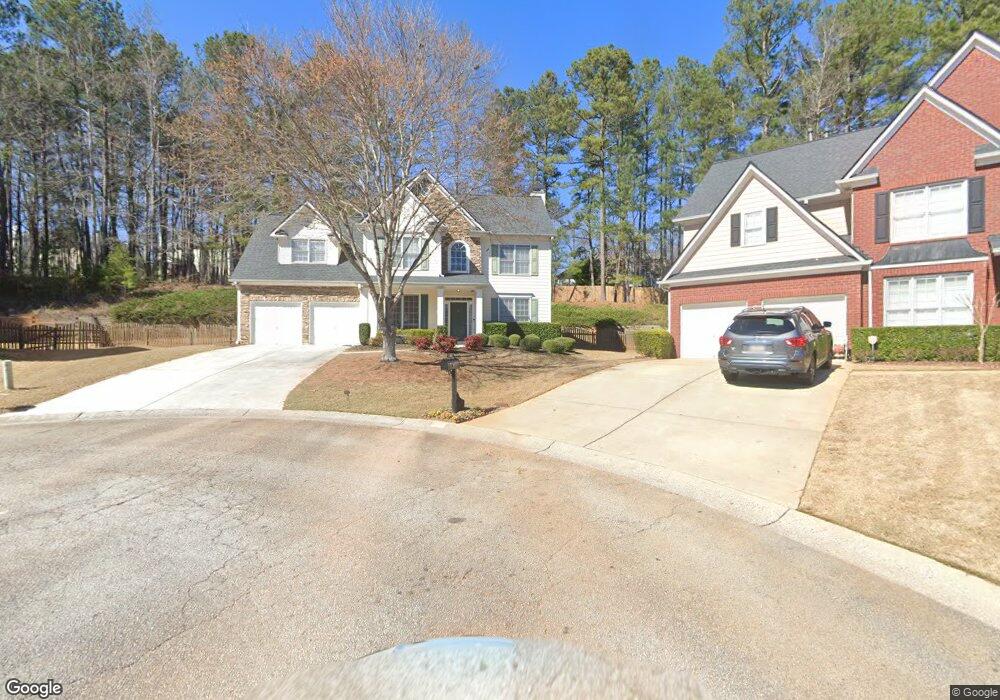
42 Skyview Point Unit 222 Dallas, GA 30157
East Paulding County NeighborhoodEstimated Value: $383,000 - $420,000
4
Beds
3
Baths
2,261
Sq Ft
$174/Sq Ft
Est. Value
About This Home
This home is located at 42 Skyview Point Unit 222, Dallas, GA 30157 and is currently estimated at $394,371, approximately $174 per square foot. 42 Skyview Point Unit 222 is a home located in Paulding County with nearby schools including Mcgarity Elementary School, P. B. Ritch Middle School, and East Paulding High School.
Ownership History
Date
Name
Owned For
Owner Type
Purchase Details
Closed on
Jan 8, 2021
Sold by
Cain Steven M
Bought by
Simmons Diandrea
Current Estimated Value
Home Financials for this Owner
Home Financials are based on the most recent Mortgage that was taken out on this home.
Original Mortgage
$255,290
Outstanding Balance
$227,847
Interest Rate
2.71%
Mortgage Type
FHA
Estimated Equity
$166,524
Purchase Details
Closed on
Jan 17, 2020
Sold by
Kelly Christine
Bought by
Cain Steven M and Cain Shantay N
Home Financials for this Owner
Home Financials are based on the most recent Mortgage that was taken out on this home.
Original Mortgage
$238,598
Interest Rate
3.62%
Mortgage Type
FHA
Purchase Details
Closed on
Jan 27, 2017
Sold by
Yakots Gwen L
Bought by
Kelly Christine
Home Financials for this Owner
Home Financials are based on the most recent Mortgage that was taken out on this home.
Original Mortgage
$130,240
Interest Rate
4.25%
Mortgage Type
FHA
Purchase Details
Closed on
Mar 19, 2009
Sold by
Yakots Frank M
Create a Home Valuation Report for This Property
The Home Valuation Report is an in-depth analysis detailing your home's value as well as a comparison with similar homes in the area
Home Values in the Area
Average Home Value in this Area
Purchase History
| Date | Buyer | Sale Price | Title Company |
|---|---|---|---|
| Simmons Diandrea | $260,000 | -- | |
| Cain Steven M | $243,000 | -- | |
| Kelly Christine | $183,000 | -- | |
| -- | -- | -- |
Source: Public Records
Mortgage History
| Date | Status | Borrower | Loan Amount |
|---|---|---|---|
| Open | Simmons Diandrea | $255,290 | |
| Previous Owner | Cain Steven M | $238,598 | |
| Previous Owner | Kelly Christine | $130,240 |
Source: Public Records
Tax History Compared to Growth
Tax History
| Year | Tax Paid | Tax Assessment Tax Assessment Total Assessment is a certain percentage of the fair market value that is determined by local assessors to be the total taxable value of land and additions on the property. | Land | Improvement |
|---|---|---|---|---|
| 2024 | $3,473 | $139,628 | $18,000 | $121,628 |
| 2023 | $3,596 | $137,944 | $18,000 | $119,944 |
| 2022 | $2,711 | $118,244 | $16,000 | $102,244 |
| 2021 | $2,728 | $93,860 | $16,000 | $77,860 |
| 2020 | $2,569 | $86,492 | $16,000 | $70,492 |
| 2019 | $2,458 | $81,596 | $16,000 | $65,596 |
| 2018 | $2,205 | $76,792 | $16,000 | $60,792 |
| 2017 | $826 | $74,752 | $16,000 | $58,752 |
| 2016 | $729 | $68,152 | $16,000 | $52,152 |
| 2015 | $734 | $65,924 | $16,000 | $49,924 |
| 2014 | $730 | $62,000 | $16,000 | $46,000 |
| 2013 | -- | $53,240 | $16,000 | $37,240 |
Source: Public Records
Map
Nearby Homes
- 468 Crestview Dr Unit 2
- 150 Doris Path
- 110 Doris Path
- 346 Thorn Creek Way
- 355 Thorn Creek Way
- 453 Thorn Creek Way
- 443 Creekwood Pass
- 326 Camry Cir
- 328 Camry Cir
- 128 Camry Cir
- 2778 MacLand Rd
- 2957 Charles Hardy Pkwy
- 157 MacLand Mill Ln
- 855 Camry Cir
- 135 Powder Creek Dr
- 29 Sedgefield Overlook
- 58 MacLand Mill Ct
- 42 Skyview Point
- 35 Skyview Point
- 38 Skyview Point
- 580 Valleyside Dr
- 598 Valleyside Dr
- 0 Skyview Point Unit 8897213
- 0 Skyview Point Unit 8697464
- 0 Skyview Point Unit 8422435
- 0 Skyview Point Unit 8077900
- 0 Skyview Point Unit 8852971
- 0 Skyview Point
- 562 Valleyside Dr
- 30 Skyview Point
- 614 Valleyside Dr Unit 232
- 614 Valleyside Dr Unit 2
- 21 Skyview Point Unit 2
- 439 Crestview Dr
- 548 Valleyside Dr Unit 2
- 60 Evans Point
- 383 Crestview Dr Unit 2