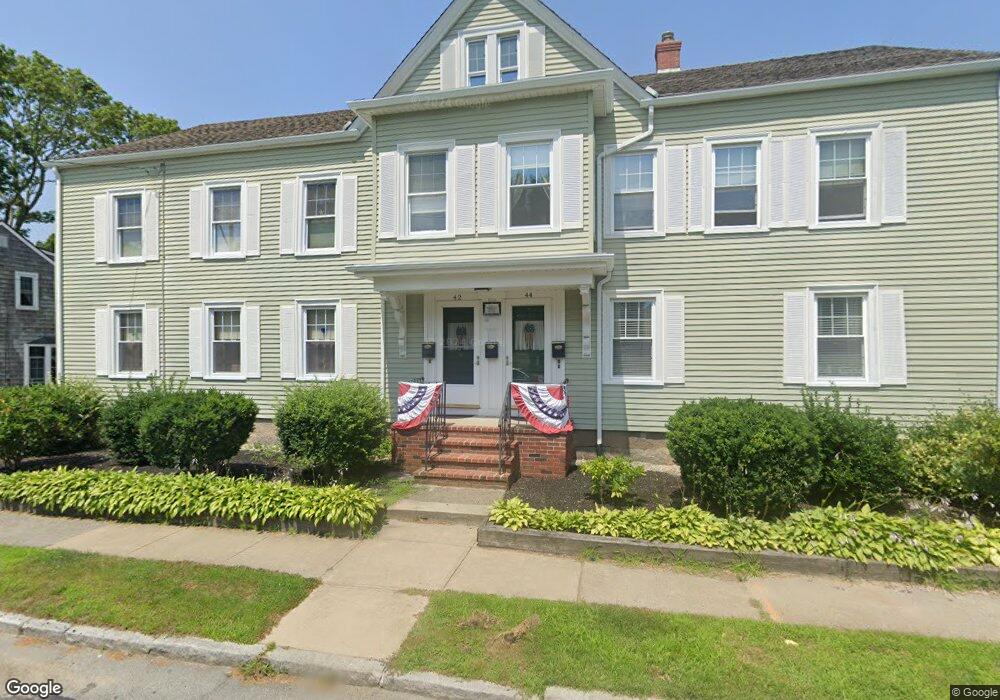
42 Spring St Fairhaven, MA 02719
Estimated Value: $499,000 - $848,000
7
Beds
4
Baths
4,184
Sq Ft
$154/Sq Ft
Est. Value
About This Home
This home is located at 42 Spring St, Fairhaven, MA 02719 and is currently estimated at $643,168, approximately $153 per square foot. 42 Spring St is a home located in Bristol County with nearby schools including Fairhaven High School, City On A Hill Charter Public School New Bedford, and St. Joseph School.
Ownership History
Date
Name
Owned For
Owner Type
Purchase Details
Closed on
Jun 6, 2011
Sold by
Audette Kristine H
Bought by
Audette Kristine H
Current Estimated Value
Home Financials for this Owner
Home Financials are based on the most recent Mortgage that was taken out on this home.
Original Mortgage
$185,000
Outstanding Balance
$72,470
Interest Rate
4.85%
Estimated Equity
$570,698
Purchase Details
Closed on
Jul 17, 1998
Sold by
E H Counsell Rt and Regis
Bought by
Lamontagne Marc P and Lamontagne Kristine H
Home Financials for this Owner
Home Financials are based on the most recent Mortgage that was taken out on this home.
Original Mortgage
$152,352
Interest Rate
6.98%
Mortgage Type
Purchase Money Mortgage
Create a Home Valuation Report for This Property
The Home Valuation Report is an in-depth analysis detailing your home's value as well as a comparison with similar homes in the area
Home Values in the Area
Average Home Value in this Area
Purchase History
| Date | Buyer | Sale Price | Title Company |
|---|---|---|---|
| Audette Kristine H | -- | -- | |
| Lamontagne Marc P | $155,000 | -- |
Source: Public Records
Mortgage History
| Date | Status | Borrower | Loan Amount |
|---|---|---|---|
| Open | Audette Kristine H | $185,000 | |
| Previous Owner | Lamontagne Marc P | $23,347 | |
| Previous Owner | Lamontagne Marc P | $25,000 | |
| Previous Owner | Lamontagne Marc P | $180,000 | |
| Previous Owner | Lamontagne Marc P | $152,352 |
Source: Public Records
Tax History
| Year | Tax Paid | Tax Assessment Tax Assessment Total Assessment is a certain percentage of the fair market value that is determined by local assessors to be the total taxable value of land and additions on the property. | Land | Improvement |
|---|---|---|---|---|
| 2025 | $55 | $591,500 | $179,400 | $412,100 |
| 2024 | $5,337 | $578,200 | $179,400 | $398,800 |
| 2023 | $5,247 | $527,300 | $157,200 | $370,100 |
| 2022 | $5,037 | $492,900 | $146,100 | $346,800 |
| 2021 | $4,723 | $418,300 | $132,200 | $286,100 |
| 2020 | $4,626 | $418,300 | $132,200 | $286,100 |
| 2019 | $4,731 | $405,400 | $109,700 | $295,700 |
| 2018 | $4,476 | $380,900 | $104,500 | $276,400 |
| 2017 | $4,287 | $356,100 | $104,500 | $251,600 |
| 2016 | $4,066 | $333,800 | $104,500 | $229,300 |
| 2015 | $3,982 | $327,700 | $104,500 | $223,200 |
Source: Public Records
Map
Nearby Homes
Your Personal Tour Guide
Ask me questions while you tour the home.