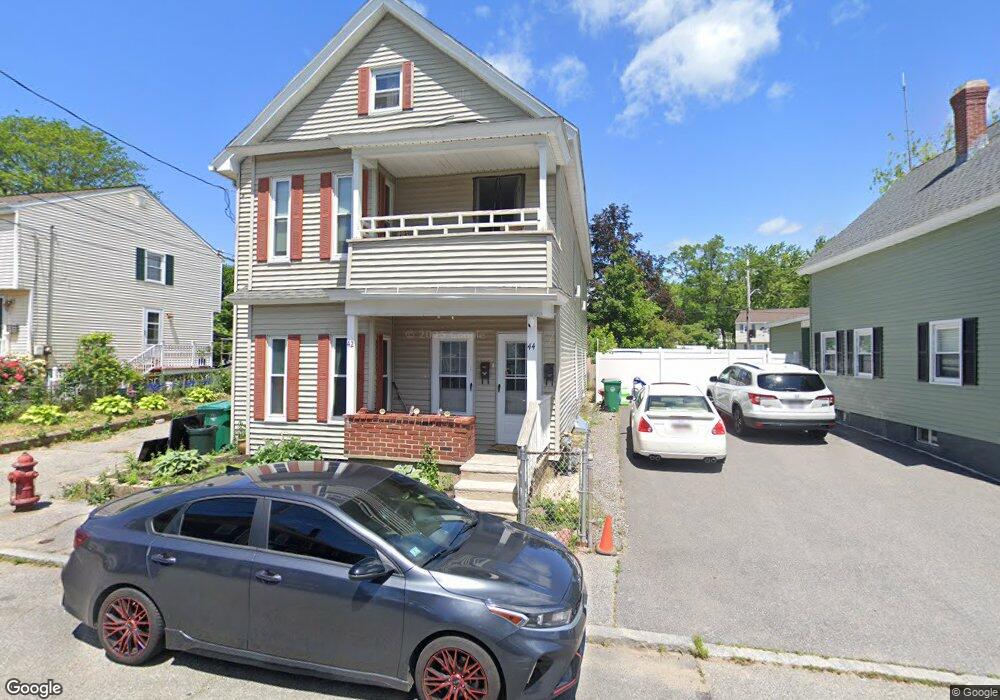
42 Sutherland St Unit 1 Lowell, MA 01850
Centralville NeighborhoodEstimated Value: $590,000 - $684,000
2
Beds
1
Bath
950
Sq Ft
$654/Sq Ft
Est. Value
About This Home
This home is located at 42 Sutherland St Unit 1, Lowell, MA 01850 and is currently estimated at $621,366, approximately $654 per square foot. 42 Sutherland St Unit 1 is a home located in Middlesex County with nearby schools including Greenhalge Elementary School, S. Christa McAuliffe Elementary School, and Moody Elementary School.
Ownership History
Date
Name
Owned For
Owner Type
Purchase Details
Closed on
Dec 19, 2018
Sold by
Dunlavey Laura A
Bought by
Gomes Josiah S and Gomes Delcarmen M
Current Estimated Value
Home Financials for this Owner
Home Financials are based on the most recent Mortgage that was taken out on this home.
Original Mortgage
$345,624
Outstanding Balance
$303,392
Interest Rate
4.62%
Mortgage Type
FHA
Estimated Equity
$317,974
Purchase Details
Closed on
Dec 10, 2018
Sold by
Langa Bridget A
Bought by
Dunlavey Laura A
Home Financials for this Owner
Home Financials are based on the most recent Mortgage that was taken out on this home.
Original Mortgage
$345,624
Outstanding Balance
$303,392
Interest Rate
4.62%
Mortgage Type
FHA
Estimated Equity
$317,974
Purchase Details
Closed on
Jul 17, 1980
Bought by
Dunlavey James E and Dunlavey Laura A
Create a Home Valuation Report for This Property
The Home Valuation Report is an in-depth analysis detailing your home's value as well as a comparison with similar homes in the area
Home Values in the Area
Average Home Value in this Area
Purchase History
| Date | Buyer | Sale Price | Title Company |
|---|---|---|---|
| Gomes Josiah S | $352,000 | -- | |
| Dunlavey Laura A | -- | -- | |
| Dunlavey Laura A | -- | -- | |
| Dunlavey James E | $40,700 | -- |
Source: Public Records
Mortgage History
| Date | Status | Borrower | Loan Amount |
|---|---|---|---|
| Open | Gomes Josiah S | $345,624 |
Source: Public Records
Tax History Compared to Growth
Tax History
| Year | Tax Paid | Tax Assessment Tax Assessment Total Assessment is a certain percentage of the fair market value that is determined by local assessors to be the total taxable value of land and additions on the property. | Land | Improvement |
|---|---|---|---|---|
| 2025 | $6,639 | $578,300 | $125,800 | $452,500 |
| 2024 | $6,252 | $524,900 | $125,000 | $399,900 |
| 2023 | $5,815 | $468,200 | $108,700 | $359,500 |
| 2022 | $5,378 | $423,800 | $98,800 | $325,000 |
| 2021 | $4,987 | $370,500 | $85,900 | $284,600 |
| 2020 | $4,448 | $332,900 | $70,600 | $262,300 |
| 2019 | $4,014 | $285,900 | $56,700 | $229,200 |
| 2018 | $3,879 | $255,500 | $54,000 | $201,500 |
| 2017 | $3,373 | $226,100 | $42,300 | $183,800 |
| 2016 | $3,476 | $229,300 | $45,500 | $183,800 |
| 2015 | $3,186 | $205,800 | $45,500 | $160,300 |
| 2013 | $2,943 | $196,100 | $60,800 | $135,300 |
Source: Public Records
Map
Nearby Homes