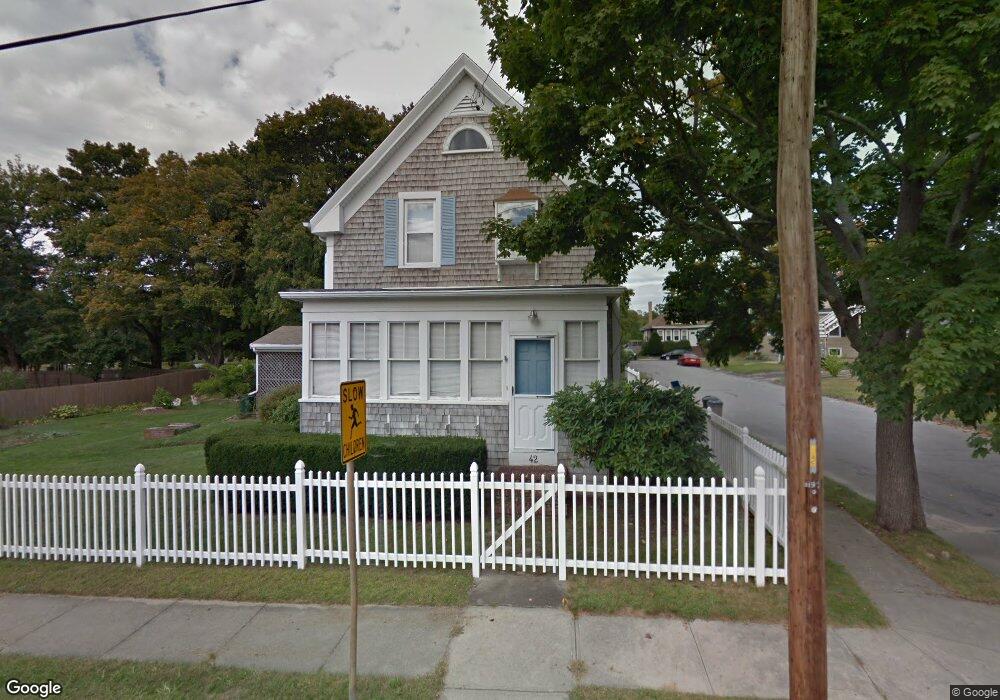
42 Taber St Fairhaven, MA 02719
Oxford NeighborhoodEstimated Value: $422,333 - $459,000
3
Beds
1
Bath
1,089
Sq Ft
$408/Sq Ft
Est. Value
About This Home
This home is located at 42 Taber St, Fairhaven, MA 02719 and is currently estimated at $443,833, approximately $407 per square foot. 42 Taber St is a home located in Bristol County with nearby schools including Fairhaven High School, Alma Del Mar Charter School, and City On A Hill Charter Public School New Bedford.
Ownership History
Date
Name
Owned For
Owner Type
Purchase Details
Closed on
Apr 25, 2014
Sold by
Loo Matthew T and Sayles Kathryn E
Bought by
Loo Matthew T and Sayles Kathryn E
Current Estimated Value
Purchase Details
Closed on
Sep 30, 2011
Sold by
Coleman Ft
Bought by
Loo Matthew T and Sayles Kathryn E
Purchase Details
Closed on
Oct 13, 2010
Sold by
Coleman Ft and Coleman Vivian B
Bought by
Coleman Ft and Camara Dianne I
Create a Home Valuation Report for This Property
The Home Valuation Report is an in-depth analysis detailing your home's value as well as a comparison with similar homes in the area
Home Values in the Area
Average Home Value in this Area
Purchase History
| Date | Buyer | Sale Price | Title Company |
|---|---|---|---|
| Loo Matthew T | -- | -- | |
| Loo Matthew T | $190,000 | -- | |
| Coleman Ft | -- | -- |
Source: Public Records
Tax History
| Year | Tax Paid | Tax Assessment Tax Assessment Total Assessment is a certain percentage of the fair market value that is determined by local assessors to be the total taxable value of land and additions on the property. | Land | Improvement |
|---|---|---|---|---|
| 2025 | $32 | $338,200 | $173,800 | $164,400 |
| 2024 | $3,046 | $330,000 | $173,800 | $156,200 |
| 2023 | $2,968 | $298,300 | $152,300 | $146,000 |
| 2022 | $2,877 | $281,500 | $141,500 | $140,000 |
| 2021 | $2,750 | $243,600 | $128,000 | $115,600 |
| 2020 | $24,487 | $243,600 | $128,000 | $115,600 |
| 2019 | $2,461 | $210,900 | $106,200 | $104,700 |
| 2018 | $1,839 | $200,400 | $101,100 | $99,300 |
| 2017 | $2,320 | $192,700 | $101,100 | $91,600 |
| 2016 | $2,252 | $184,900 | $101,100 | $83,800 |
| 2015 | $2,244 | $184,700 | $101,100 | $83,600 |
Source: Public Records
Map
Nearby Homes
- 442 Dana Farms
- 14 Sycamore St
- 313 Main St
- 253 Adams St
- 24 Academy Ave
- 10 Livesey Pkwy
- 71 Sycamore St
- 138 Main St Unit 13
- 15 School St
- 16 Ash St
- 67 Bridge St
- 24 Cotter St
- 34 Washburn St Unit 36
- 39 Christian St
- 77 Adams St
- 239 Sawyer St
- 7 Deerfield Ln
- 8 Washington St
- 0 Nulands Neck Unit 73286360
- 1301 Pleasant St Unit 1305
Your Personal Tour Guide
Ask me questions while you tour the home.