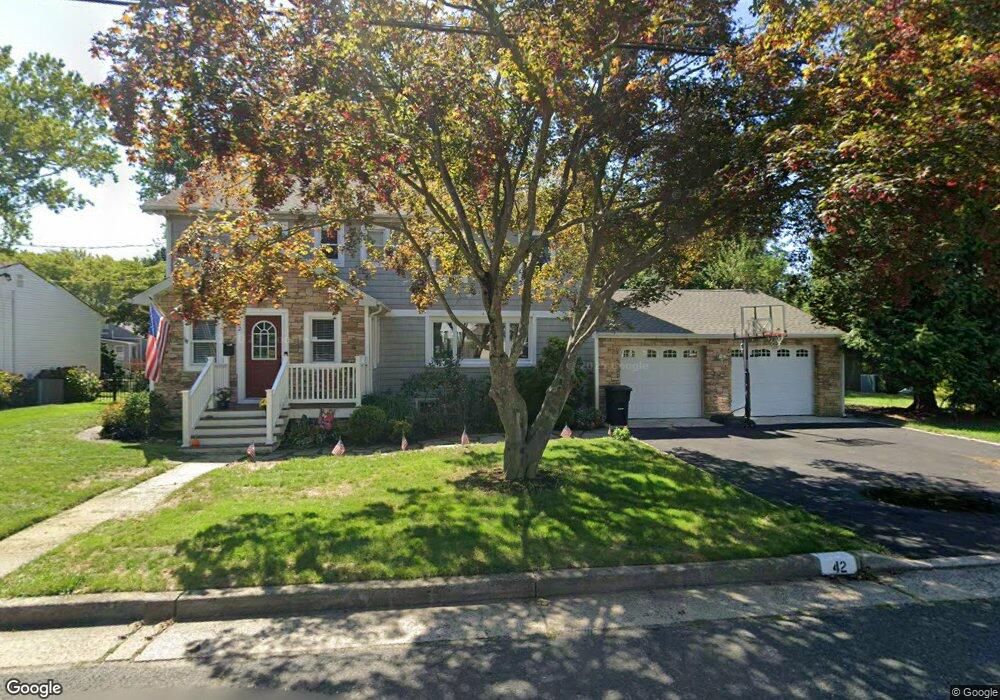
42 Tecumseh Ave Oceanport, NJ 07757
Estimated Value: $952,000 - $957,000
3
Beds
3
Baths
1,758
Sq Ft
$543/Sq Ft
Est. Value
About This Home
This home is located at 42 Tecumseh Ave, Oceanport, NJ 07757 and is currently estimated at $954,176, approximately $542 per square foot. 42 Tecumseh Ave is a home located in Monmouth County with nearby schools including Wolf Hill Elementary School, Maple Place Elementary and Middle School, and Shore Regional High School.
Ownership History
Date
Name
Owned For
Owner Type
Purchase Details
Closed on
Jul 31, 2009
Sold by
Ilvento Andrew
Bought by
Marcantonio Scott and Marcantonio Suzanne
Current Estimated Value
Home Financials for this Owner
Home Financials are based on the most recent Mortgage that was taken out on this home.
Original Mortgage
$325,000
Outstanding Balance
$214,694
Interest Rate
5.47%
Mortgage Type
Stand Alone First
Estimated Equity
$739,482
Purchase Details
Closed on
Jun 9, 2005
Sold by
Sperling Lori
Bought by
Ilvento Andrew
Home Financials for this Owner
Home Financials are based on the most recent Mortgage that was taken out on this home.
Original Mortgage
$423,200
Interest Rate
4.87%
Mortgage Type
Adjustable Rate Mortgage/ARM
Purchase Details
Closed on
Aug 11, 2003
Sold by
Landquist Michele
Bought by
Sperling Lori and Sperling Jeff
Home Financials for this Owner
Home Financials are based on the most recent Mortgage that was taken out on this home.
Original Mortgage
$274,500
Interest Rate
6.22%
Create a Home Valuation Report for This Property
The Home Valuation Report is an in-depth analysis detailing your home's value as well as a comparison with similar homes in the area
Home Values in the Area
Average Home Value in this Area
Purchase History
| Date | Buyer | Sale Price | Title Company |
|---|---|---|---|
| Marcantonio Scott | $510,000 | River Edge Title Agency Llc | |
| Ilvento Andrew | $529,000 | -- | |
| Sperling Lori | $305,000 | -- |
Source: Public Records
Mortgage History
| Date | Status | Borrower | Loan Amount |
|---|---|---|---|
| Open | Marcantonio Scott | $325,000 | |
| Previous Owner | Ilvento Andrew | $423,200 | |
| Previous Owner | Sperling Lori | $274,500 |
Source: Public Records
Tax History Compared to Growth
Tax History
| Year | Tax Paid | Tax Assessment Tax Assessment Total Assessment is a certain percentage of the fair market value that is determined by local assessors to be the total taxable value of land and additions on the property. | Land | Improvement |
|---|---|---|---|---|
| 2025 | $11,560 | $785,100 | $440,000 | $345,100 |
| 2024 | $11,824 | $732,100 | $402,000 | $330,100 |
| 2023 | $11,824 | $710,600 | $397,000 | $313,600 |
| 2022 | $11,041 | $623,100 | $347,000 | $276,100 |
| 2021 | $11,041 | $579,600 | $317,000 | $262,600 |
| 2020 | $10,507 | $574,800 | $300,000 | $274,800 |
| 2019 | $9,999 | $555,200 | $290,000 | $265,200 |
| 2018 | $9,875 | $552,000 | $290,000 | $262,000 |
| 2017 | $10,582 | $490,600 | $173,000 | $317,600 |
| 2016 | $10,535 | $491,600 | $180,000 | $311,600 |
| 2015 | $10,030 | $483,600 | $180,000 | $303,600 |
| 2014 | $9,395 | $459,400 | $190,000 | $269,400 |
Source: Public Records
Map
Nearby Homes
- 15 Signal Ave
- 3 Foggia Way
- 1 Foggia Way
- 13 Morris Place
- 10 Asbury Ave
- 24 Baruch Dr
- 27 Ithaca Ave
- 222 Coleman Ave
- 580 Patten Ave Unit 47
- 580 Patten Ave Unit 48
- 580 Patten Ave Unit 62
- 580 Patten Ave Unit 86
- 238 Branchport Ave
- 572 Jay St
- 565 Joline Ave
- 190 Spruce St Unit 4
- 177 Kingsley St
- 57 Bridgewaters Dr Unit 21
- 13 Bayview Ct
- 392 Florence Ave
- 38 Tecumseh Ave
- 46 Tecumseh Ave
- 57 Shrewsbury Ave
- 61 Shrewsbury Ave
- 53 Shrewsbury Ave
- 45 Tecumseh Ave
- 43 Tecumseh Ave
- 47 Tecumseh Ave
- 50 Tecumseh Ave
- 49 Tecumseh Ave
- 34 Tecumseh Ave
- 49 Shrewsbury Ave
- 39 Tecumseh Ave
- 50 Iroquois Ave
- 55A Tecumseh Ave
- 58 Iroquois Ave
- 46 Iroquois Ave
- 538 Shrewsbury Ave
- 542 Shrewsbury Ave
- 0 Shrewsbury Ave