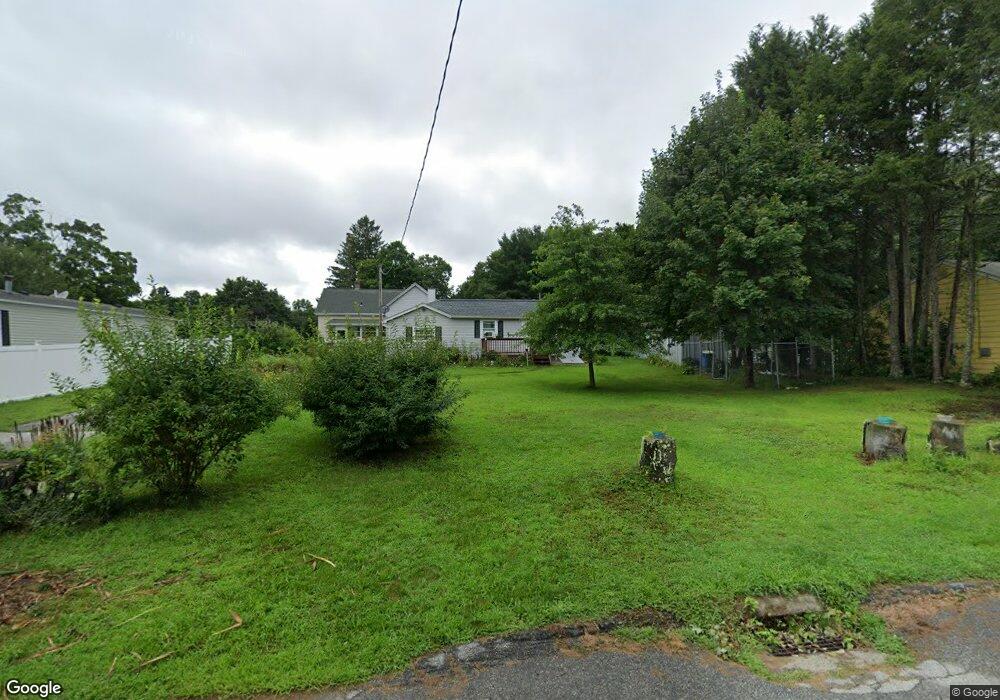
42 Tom St Danielson, CT 06239
Estimated Value: $189,249 - $245,000
1
Bed
1
Bath
684
Sq Ft
$317/Sq Ft
Est. Value
About This Home
This home is located at 42 Tom St, Danielson, CT 06239 and is currently estimated at $216,812, approximately $316 per square foot. 42 Tom St is a home located in Windham County with nearby schools including Killingly Central School, Killingly Memorial School, and Killingly Intermediate School.
Ownership History
Date
Name
Owned For
Owner Type
Purchase Details
Closed on
Nov 23, 2005
Sold by
Buroitt Joan A
Bought by
March Debra A
Current Estimated Value
Home Financials for this Owner
Home Financials are based on the most recent Mortgage that was taken out on this home.
Original Mortgage
$88,000
Outstanding Balance
$29,914
Interest Rate
6.06%
Estimated Equity
$186,898
Purchase Details
Closed on
Nov 30, 1995
Sold by
Corner Prop Inc
Bought by
Burditt Frank W
Home Financials for this Owner
Home Financials are based on the most recent Mortgage that was taken out on this home.
Original Mortgage
$39,920
Interest Rate
7.37%
Mortgage Type
Unknown
Create a Home Valuation Report for This Property
The Home Valuation Report is an in-depth analysis detailing your home's value as well as a comparison with similar homes in the area
Home Values in the Area
Average Home Value in this Area
Purchase History
| Date | Buyer | Sale Price | Title Company |
|---|---|---|---|
| March Debra A | $110,000 | -- | |
| March Debra A | $110,000 | -- | |
| Burditt Frank W | $49,500 | -- | |
| Burditt Frank W | $49,500 | -- |
Source: Public Records
Mortgage History
| Date | Status | Borrower | Loan Amount |
|---|---|---|---|
| Open | Burditt Frank W | $88,000 | |
| Closed | Burditt Frank W | $88,000 | |
| Previous Owner | Burditt Frank W | $67,000 | |
| Previous Owner | Burditt Frank W | $39,920 |
Source: Public Records
Tax History
| Year | Tax Paid | Tax Assessment Tax Assessment Total Assessment is a certain percentage of the fair market value that is determined by local assessors to be the total taxable value of land and additions on the property. | Land | Improvement |
|---|---|---|---|---|
| 2025 | $2,322 | $99,020 | $28,750 | $70,270 |
| 2024 | $2,185 | $99,020 | $28,750 | $70,270 |
| 2023 | $1,837 | $64,120 | $23,730 | $40,390 |
| 2022 | $1,725 | $64,120 | $23,730 | $40,390 |
| 2021 | $1,725 | $64,120 | $23,730 | $40,390 |
| 2020 | $1,689 | $64,120 | $23,730 | $40,390 |
| 2019 | $1,722 | $64,120 | $23,730 | $40,390 |
| 2017 | $1,352 | $46,270 | $15,120 | $31,150 |
| 2016 | $1,347 | $46,270 | $15,120 | $31,150 |
| 2015 | $1,356 | $46,270 | $15,120 | $31,150 |
| 2014 | $1,319 | $46,270 | $15,120 | $31,150 |
Source: Public Records
Map
Nearby Homes
- 61 Deerwood Dr
- 48 Athol St Unit 48
- 14 Valley View Dr
- 16 Valley View Dr
- 74 Athol St
- 724 Cook Hill Rd
- 144 Prospect Ave
- 85 Mashentuck Rd
- 73 Hawkins St
- 11 Kenneth Dr
- 175 Mashentuck Rd
- 10 Center St
- 24 Center St
- 842 Hartford Pike
- 941 Upper Maple St
- 23 Brookside Dr
- 133 Maple St
- 102 Cottage St
- 150 Broad St
- 37 Ruth St
Your Personal Tour Guide
Ask me questions while you tour the home.