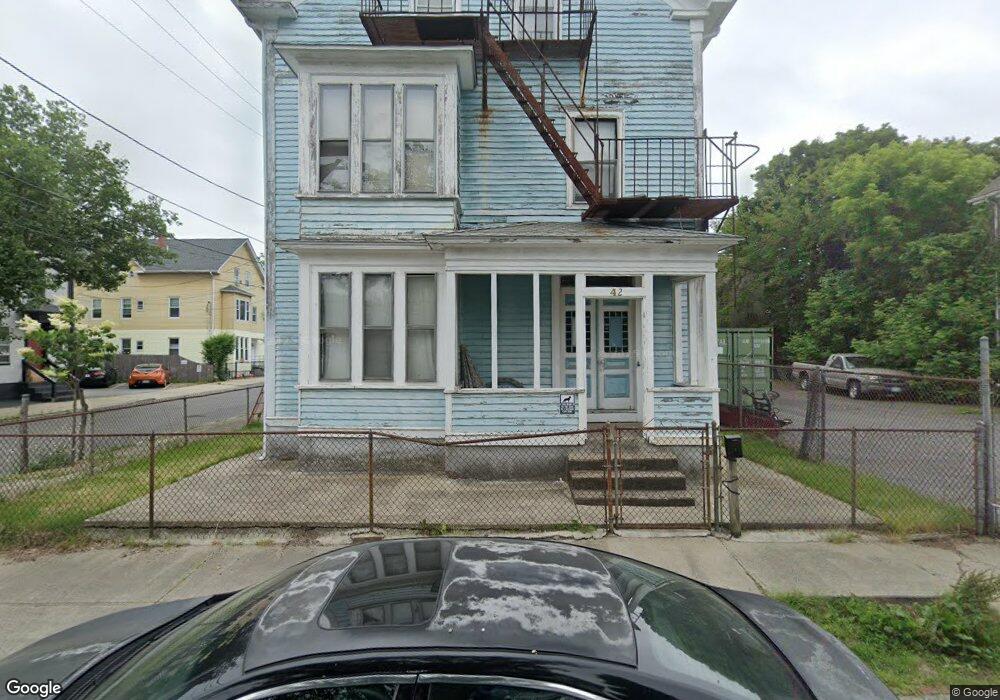
42 Tuxedo Ave Providence, RI 02909
Olneyville NeighborhoodEstimated Value: $595,000 - $638,000
8
Beds
3
Baths
2,554
Sq Ft
$243/Sq Ft
Est. Value
About This Home
This home is located at 42 Tuxedo Ave, Providence, RI 02909 and is currently estimated at $620,000, approximately $242 per square foot. 42 Tuxedo Ave is a home located in Providence County with nearby schools including Asa Messer Elementary School, Charles N. Fortes Elementary School, and Laurel Hill Annex School.
Ownership History
Date
Name
Owned For
Owner Type
Purchase Details
Closed on
Jul 7, 2023
Sold by
Providence City Of and Blevins
Bought by
Westcott Realty Rigp
Current Estimated Value
Purchase Details
Closed on
Jun 13, 2016
Sold by
Midwood Assoc Rigp and Providence City Of
Bought by
Blevins Kathleen
Purchase Details
Closed on
Jun 9, 2015
Sold by
Blevins Kathleen and Providence City Of
Bought by
Blevins Kathleen
Purchase Details
Closed on
Jul 30, 2007
Sold by
Blevins Kathleen and Mayo County
Bought by
Blevins Kathleen
Create a Home Valuation Report for This Property
The Home Valuation Report is an in-depth analysis detailing your home's value as well as a comparison with similar homes in the area
Home Values in the Area
Average Home Value in this Area
Purchase History
| Date | Buyer | Sale Price | Title Company |
|---|---|---|---|
| Westcott Realty Rigp | $2,996 | None Available | |
| Blevins Kathleen | $5,138 | -- | |
| Blevins Kathleen | $5,139 | -- | |
| Blevins Kathleen | $3,306 | -- |
Source: Public Records
Tax History Compared to Growth
Tax History
| Year | Tax Paid | Tax Assessment Tax Assessment Total Assessment is a certain percentage of the fair market value that is determined by local assessors to be the total taxable value of land and additions on the property. | Land | Improvement |
|---|---|---|---|---|
| 2025 | $3,443 | $456,000 | $139,300 | $316,700 |
| 2024 | $5,549 | $302,400 | $91,500 | $210,900 |
| 2023 | $5,549 | $302,400 | $91,500 | $210,900 |
| 2022 | $5,383 | $302,400 | $91,500 | $210,900 |
| 2021 | $3,876 | $157,800 | $42,500 | $115,300 |
| 2020 | $3,876 | $157,800 | $42,500 | $115,300 |
| 2019 | $3,876 | $157,800 | $42,500 | $115,300 |
| 2018 | $4,075 | $127,500 | $44,100 | $83,400 |
| 2017 | $3,937 | $123,200 | $44,100 | $79,100 |
| 2016 | $3,937 | $123,200 | $44,100 | $79,100 |
| 2015 | $3,555 | $107,400 | $44,100 | $63,300 |
| 2014 | $3,625 | $107,400 | $44,100 | $63,300 |
| 2013 | -- | $107,400 | $44,100 | $63,300 |
Source: Public Records
Map
Nearby Homes