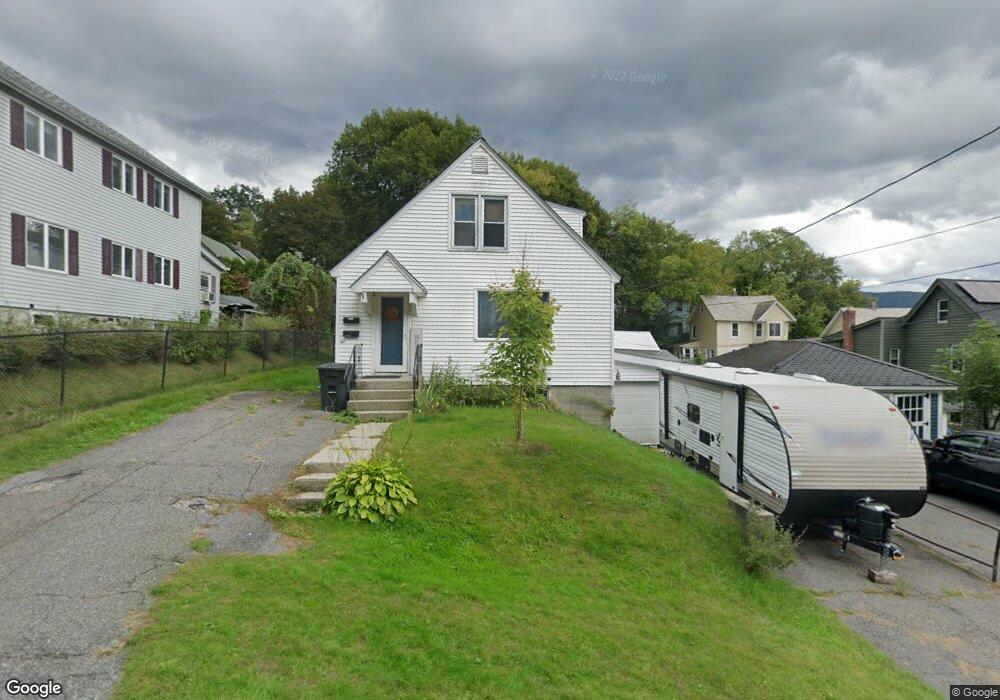
42 Tyler St North Adams, MA 01247
Estimated Value: $176,000 - $226,000
6
Beds
2
Baths
2,162
Sq Ft
$96/Sq Ft
Est. Value
About This Home
This home is located at 42 Tyler St, North Adams, MA 01247 and is currently estimated at $207,265, approximately $95 per square foot. 42 Tyler St is a home located in Berkshire County with nearby schools including Greylock Elementary School and Drury High School.
Ownership History
Date
Name
Owned For
Owner Type
Purchase Details
Closed on
May 18, 2011
Sold by
Bernardi Richard J
Bought by
George Michael F and George Rosanne M
Current Estimated Value
Home Financials for this Owner
Home Financials are based on the most recent Mortgage that was taken out on this home.
Original Mortgage
$115,000
Outstanding Balance
$79,794
Interest Rate
5%
Mortgage Type
Purchase Money Mortgage
Estimated Equity
$127,471
Purchase Details
Closed on
Sep 4, 2007
Sold by
Bernardi Donna Y and Bernardi Richard J
Bought by
Bernardi Richard J
Purchase Details
Closed on
Jan 16, 1998
Sold by
Bernardi Ruth
Bought by
Bernardi Richard J and Bernardi Doona Y
Home Financials for this Owner
Home Financials are based on the most recent Mortgage that was taken out on this home.
Original Mortgage
$50,000
Interest Rate
7.08%
Mortgage Type
Purchase Money Mortgage
Create a Home Valuation Report for This Property
The Home Valuation Report is an in-depth analysis detailing your home's value as well as a comparison with similar homes in the area
Home Values in the Area
Average Home Value in this Area
Purchase History
| Date | Buyer | Sale Price | Title Company |
|---|---|---|---|
| George Michael F | $106,000 | -- | |
| George Michael F | $106,000 | -- | |
| Bernardi Richard J | -- | -- | |
| Bernardi Richard J | -- | -- | |
| Bernardi Richard J | $50,000 | -- | |
| Bernardi Richard J | $50,000 | -- |
Source: Public Records
Mortgage History
| Date | Status | Borrower | Loan Amount |
|---|---|---|---|
| Open | Bernardi Richard J | $115,000 | |
| Closed | Bernardi Richard J | $115,000 | |
| Previous Owner | Bernardi Richard J | $50,000 |
Source: Public Records
Tax History Compared to Growth
Tax History
| Year | Tax Paid | Tax Assessment Tax Assessment Total Assessment is a certain percentage of the fair market value that is determined by local assessors to be the total taxable value of land and additions on the property. | Land | Improvement |
|---|---|---|---|---|
| 2025 | $2,567 | $153,600 | $32,800 | $120,800 |
| 2024 | $2,408 | $140,500 | $30,000 | $110,500 |
| 2023 | $2,182 | $123,500 | $30,000 | $93,500 |
| 2022 | $2,146 | $115,800 | $30,000 | $85,800 |
| 2021 | $1,995 | $107,200 | $27,800 | $79,400 |
| 2020 | $1,920 | $103,100 | $26,500 | $76,600 |
| 2019 | $1,928 | $100,900 | $27,100 | $73,800 |
| 2018 | $1,908 | $103,800 | $29,100 | $74,700 |
| 2017 | $1,816 | $102,800 | $28,800 | $74,000 |
| 2016 | $1,788 | $102,800 | $28,800 | $74,000 |
| 2015 | $1,732 | $103,800 | $29,800 | $74,000 |
Source: Public Records
Map
Nearby Homes
- 50 1/2 Williams St
- 0 River St
- 86 W Main St
- 84 W Main St
- 166 Houghton St
- 26 Charles St
- 5 Whitman St
- 16 Forrest St
- 0 Whitman St
- 62-64 Chase Ave
- 37 Fuller St
- 34 Goodrich St
- 85 Furnace St
- 20 Barlow Ave
- 66-68 Bracewell Ave
- 152 Furnace St
- 33-35 Hall St
- 55 First St
- 19 N Church St Unit 11
- 19 N Church St Unit 14