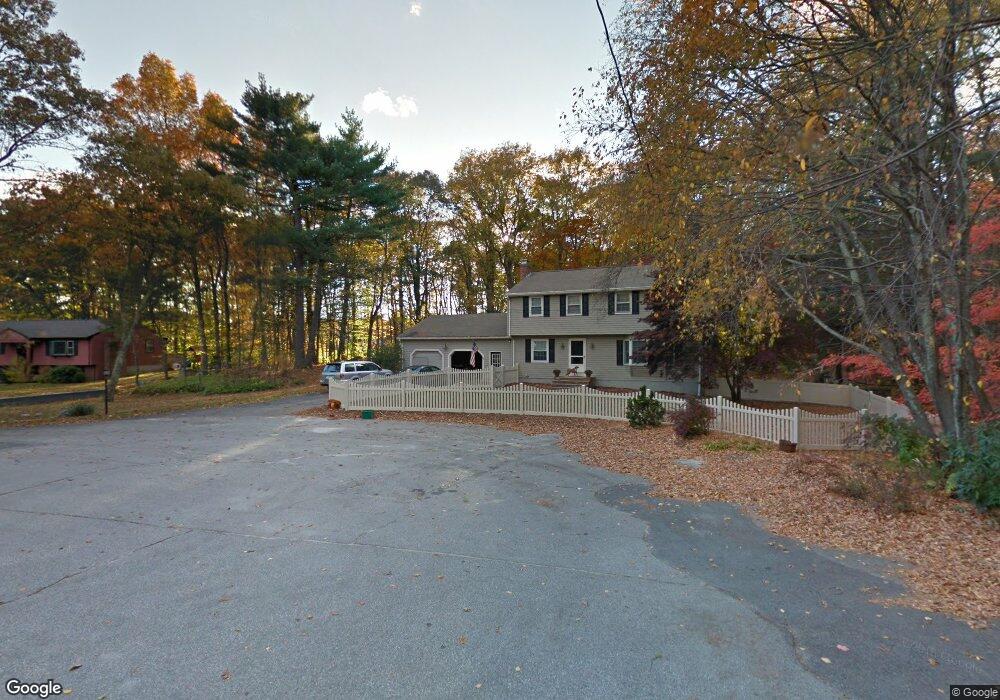
42 Walnut Rd Holliston, MA 01746
Estimated Value: $731,000 - $822,000
4
Beds
3
Baths
1,944
Sq Ft
$392/Sq Ft
Est. Value
About This Home
This home is located at 42 Walnut Rd, Holliston, MA 01746 and is currently estimated at $762,510, approximately $392 per square foot. 42 Walnut Rd is a home located in Middlesex County with nearby schools including Miller Elementary School, Robert H. Adams Middle School, and Holliston High School.
Ownership History
Date
Name
Owned For
Owner Type
Purchase Details
Closed on
Apr 2, 2012
Sold by
Wall Street Dev Corp
Bought by
Kagno Todd A and Kagno Rachel W
Current Estimated Value
Purchase Details
Closed on
Dec 5, 2002
Sold by
Leblanc Kenneth R and Leblanc Judith E
Bought by
Kagno Todd A and Kagno Rachel W
Home Financials for this Owner
Home Financials are based on the most recent Mortgage that was taken out on this home.
Original Mortgage
$200,000
Interest Rate
6.34%
Mortgage Type
Purchase Money Mortgage
Purchase Details
Closed on
Apr 1, 1999
Sold by
Flanagan Thomas W and Flanagan Rita K
Bought by
Leblanc Kenneth R and Leblanc Judith E
Home Financials for this Owner
Home Financials are based on the most recent Mortgage that was taken out on this home.
Original Mortgage
$212,000
Interest Rate
6.78%
Mortgage Type
Purchase Money Mortgage
Create a Home Valuation Report for This Property
The Home Valuation Report is an in-depth analysis detailing your home's value as well as a comparison with similar homes in the area
Home Values in the Area
Average Home Value in this Area
Purchase History
| Date | Buyer | Sale Price | Title Company |
|---|---|---|---|
| Kagno Todd A | -- | -- | |
| Kagno Todd A | $417,000 | -- | |
| Leblanc Kenneth R | $285,000 | -- |
Source: Public Records
Mortgage History
| Date | Status | Borrower | Loan Amount |
|---|---|---|---|
| Previous Owner | Kagno Todd A | $200,000 | |
| Previous Owner | Leblanc Kenneth R | $212,000 | |
| Previous Owner | Leblanc Kenneth R | $84,000 |
Source: Public Records
Tax History Compared to Growth
Tax History
| Year | Tax Paid | Tax Assessment Tax Assessment Total Assessment is a certain percentage of the fair market value that is determined by local assessors to be the total taxable value of land and additions on the property. | Land | Improvement |
|---|---|---|---|---|
| 2025 | $9,662 | $659,500 | $256,900 | $402,600 |
| 2024 | $8,637 | $573,500 | $256,900 | $316,600 |
| 2023 | $8,435 | $547,700 | $256,900 | $290,800 |
| 2022 | $8,386 | $482,500 | $256,900 | $225,600 |
| 2021 | $8,400 | $470,600 | $245,000 | $225,600 |
| 2020 | $8,072 | $428,200 | $220,700 | $207,500 |
| 2019 | $7,941 | $421,700 | $214,200 | $207,500 |
| 2018 | $7,873 | $421,700 | $214,200 | $207,500 |
| 2017 | $8,186 | $442,000 | $218,700 | $223,300 |
| 2016 | $7,529 | $400,700 | $187,800 | $212,900 |
| 2015 | $7,118 | $367,300 | $153,100 | $214,200 |
Source: Public Records
Map
Nearby Homes
- 75 Ridge Rd
- 263 Chamberlain St
- 56 Paul Rd
- 30 Arthur St
- 1037 Washington St
- 1014 Highland St
- 154 Union St
- 7 Hill St
- 15 Broad Acres Farm Rd
- 1366 Washington St
- 12 Longmeadow Ln
- 116 Winthrop St
- 110 Bonney Dr
- 20 Hargrave Ave
- 43 Bittersweet Cir Unit 43
- 0 Hill St
- Lot 2 Hanlon Rd
- 19 Sycamore Way Unit L40
- 625 Norfolk St
- 156 Mitchell Rd