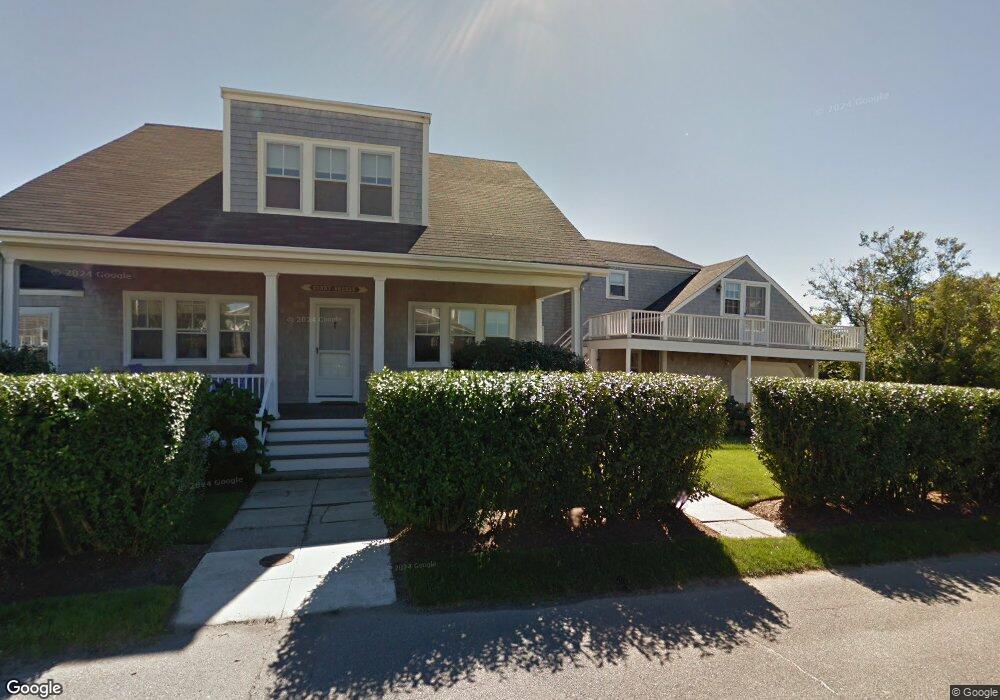
42 Walsh St Nantucket, MA 02554
Estimated Value: $4,225,000 - $5,281,000
5
Beds
4
Baths
2,535
Sq Ft
$1,875/Sq Ft
Est. Value
About This Home
This home is located at 42 Walsh St, Nantucket, MA 02554 and is currently estimated at $4,752,775, approximately $1,874 per square foot. 42 Walsh St is a home located in Nantucket County with nearby schools including Nantucket Elementary School, Cyrus Peirce Middle School, and Nantucket High School.
Ownership History
Date
Name
Owned For
Owner Type
Purchase Details
Closed on
Dec 13, 2011
Sold by
Qprt Henry L Belber
Bought by
Belber Katherine M and Belber Stephen L
Current Estimated Value
Purchase Details
Closed on
Jan 14, 2009
Sold by
Belber Mary Jane Est and Belber
Bought by
Belber Katherine M and Belber Stephen L
Create a Home Valuation Report for This Property
The Home Valuation Report is an in-depth analysis detailing your home's value as well as a comparison with similar homes in the area
Home Values in the Area
Average Home Value in this Area
Purchase History
| Date | Buyer | Sale Price | Title Company |
|---|---|---|---|
| Belber Katherine M | -- | -- | |
| Belber Katherine M | -- | -- | |
| Belber Katherine M | -- | -- | |
| Belber Stephen L | -- | -- | |
| Belber Stephen L | -- | -- | |
| Belber Katherine M | -- | -- |
Source: Public Records
Tax History Compared to Growth
Tax History
| Year | Tax Paid | Tax Assessment Tax Assessment Total Assessment is a certain percentage of the fair market value that is determined by local assessors to be the total taxable value of land and additions on the property. | Land | Improvement |
|---|---|---|---|---|
| 2025 | $13,200 | $4,024,400 | $2,191,100 | $1,833,300 |
| 2024 | $12,723 | $4,065,000 | $2,231,700 | $1,833,300 |
| 2023 | $9,526 | $2,967,700 | $2,125,800 | $841,900 |
| 2022 | $9,590 | $2,564,100 | $1,935,000 | $629,100 |
| 2021 | $7,692 | $2,119,000 | $1,548,000 | $571,000 |
| 2020 | $7,756 | $2,248,000 | $1,677,000 | $571,000 |
| 2019 | $7,531 | $2,241,500 | $1,670,500 | $571,000 |
| 2018 | $7,746 | $2,194,200 | $1,606,300 | $587,900 |
| 2017 | $7,286 | $2,149,200 | $1,561,300 | $587,900 |
| 2016 | $7,027 | $2,091,400 | $1,542,000 | $549,400 |
| 2015 | $6,433 | $1,782,000 | $1,247,600 | $534,400 |
| 2014 | $6,239 | $1,659,400 | $1,247,600 | $411,800 |
Source: Public Records
Map
Nearby Homes