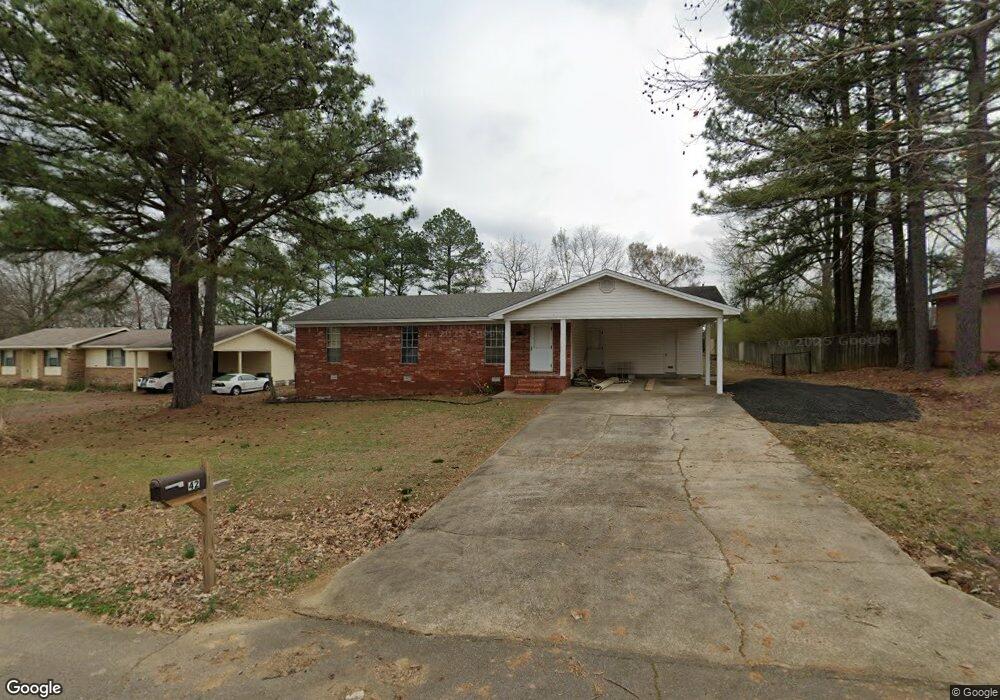
42 Westgate St Searcy, AR 72143
Estimated Value: $141,000 - $183,998
Studio
2
Baths
1,314
Sq Ft
$121/Sq Ft
Est. Value
About This Home
This home is located at 42 Westgate St, Searcy, AR 72143 and is currently estimated at $158,750, approximately $120 per square foot. 42 Westgate St is a home located in White County with nearby schools including Westside Elementary School, Southwest Middle School, and Ahlf Junior High School.
Ownership History
Date
Name
Owned For
Owner Type
Purchase Details
Closed on
Feb 27, 2023
Sold by
Coleman Monty and Coleman Jason
Bought by
Thomas Austin Lance and Thomas Jacquelyn
Current Estimated Value
Home Financials for this Owner
Home Financials are based on the most recent Mortgage that was taken out on this home.
Original Mortgage
$111,111
Outstanding Balance
$107,510
Interest Rate
6.15%
Mortgage Type
New Conventional
Estimated Equity
$51,240
Purchase Details
Closed on
Jan 25, 2023
Sold by
Coleman Monty
Bought by
Coleman Monty and Coleman Jason
Home Financials for this Owner
Home Financials are based on the most recent Mortgage that was taken out on this home.
Original Mortgage
$111,111
Outstanding Balance
$107,510
Interest Rate
6.15%
Mortgage Type
New Conventional
Estimated Equity
$51,240
Purchase Details
Closed on
Sep 1, 1987
Bought by
Coleman Sandra Dee
Purchase Details
Closed on
Dec 1, 1981
Bought by
Raines Bobby J and Raines Sandra D
Create a Home Valuation Report for This Property
The Home Valuation Report is an in-depth analysis detailing your home's value as well as a comparison with similar homes in the area
Purchase History
| Date | Buyer | Sale Price | Title Company |
|---|---|---|---|
| Thomas Austin Lance | $110,000 | Professional Land Title | |
| Coleman Monty | -- | -- | |
| Coleman Monty | -- | None Listed On Document | |
| Coleman Sandra Dee | -- | -- | |
| Raines Bobby J | $47,100 | -- |
Source: Public Records
Mortgage History
| Date | Status | Borrower | Loan Amount |
|---|---|---|---|
| Open | Thomas Austin Lance | $111,111 |
Source: Public Records
Tax History
| Year | Tax Paid | Tax Assessment Tax Assessment Total Assessment is a certain percentage of the fair market value that is determined by local assessors to be the total taxable value of land and additions on the property. | Land | Improvement |
|---|---|---|---|---|
| 2025 | $858 | $21,138 | $5,760 | $15,378 |
| 2024 | $858 | $21,138 | $5,760 | $15,378 |
| 2023 | $290 | $20,650 | $5,760 | $14,890 |
| 2022 | $306 | $20,650 | $5,760 | $14,890 |
| 2021 | $306 | $20,650 | $5,760 | $14,890 |
| 2020 | $306 | $21,680 | $9,800 | $11,880 |
| 2019 | $306 | $21,680 | $9,800 | $11,880 |
| 2018 | $331 | $21,680 | $9,800 | $11,880 |
| 2017 | $681 | $21,680 | $9,800 | $11,880 |
| 2016 | $681 | $16,770 | $9,800 | $6,970 |
| 2015 | $681 | $16,770 | $5,900 | $10,870 |
| 2014 | $681 | $16,770 | $5,900 | $10,870 |
Source: Public Records
Map
Nearby Homes
- 134 Mary Irene Ln
- 7 Palmer Ct
- 431 Natalie Cir
- 111 Charles Thomas Blvd
- 2201 Caleb Dr
- 00-Lot C W Beebe Capps Expy
- 0 W Beebe Capps Expy Unit 22023380
- 00-Lot A W Beebe Capps Expy
- 00-Lot B W Beebe Capps Expy
- 2109 Daniel Dr
- 116 N Sawmill Rd
- 318 N Sawmill Rd
- 2006 Caleb Dr
- 19 Hartwell Place
- 505 Chesapeake Dr
- 8.3 acres off Verkler Ln
- 2102 Jonathan Ln
- 42 Stoneybrook Ln
- 103 S Greer Dr
- 32 Stoneybrook Ln
- 40 Westgate St
- 44 Westgate St
- 311 Billy Davis Dr
- 38 Westgate St
- 313 Billy Davis Dr
- 309 Billy Davis Dr
- 38 Westgate Dr
- 46 Westgate St
- 41 Westgate St
- 305 Billy Davis Dr
- 39 Westgate St
- 36 Westgate St
- 315 Billy Davis Dr
- 43 Westgate St
- 37 Westgate St
- 303 Billy Davis Dr
- 312 Billy Davis Dr
- 3 Spurlock Dr
- 310 Billy Davis Dr
- 35 Westgate St
Your Personal Tour Guide
Ask me questions while you tour the home.