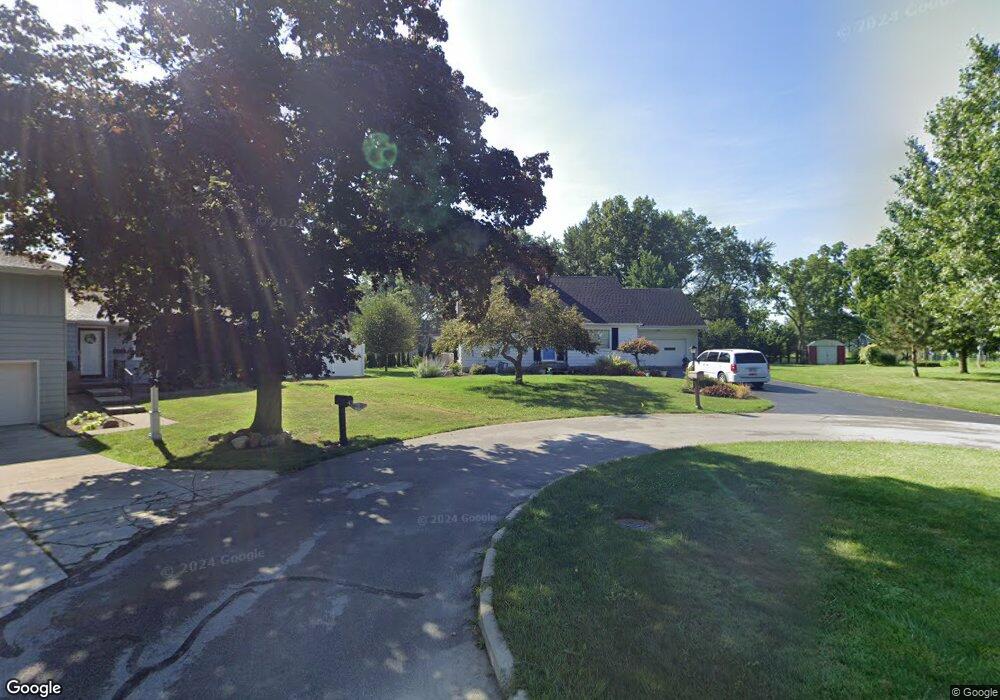
42 Westview Ct Tiffin, OH 44883
Estimated Value: $220,000 - $281,000
4
Beds
2
Baths
2,114
Sq Ft
$119/Sq Ft
Est. Value
About This Home
This home is located at 42 Westview Ct, Tiffin, OH 44883 and is currently estimated at $250,634, approximately $118 per square foot. 42 Westview Ct is a home located in Seneca County with nearby schools including Columbian High School, Bridges Community Academy, and Calvert High School.
Ownership History
Date
Name
Owned For
Owner Type
Purchase Details
Closed on
May 7, 2010
Sold by
Reymann Lawrence L
Bought by
Guzowski Bruce A and Guzowski Jeanette S
Current Estimated Value
Home Financials for this Owner
Home Financials are based on the most recent Mortgage that was taken out on this home.
Original Mortgage
$99,750
Outstanding Balance
$67,672
Interest Rate
5.3%
Mortgage Type
New Conventional
Estimated Equity
$182,962
Purchase Details
Closed on
Apr 15, 2005
Sold by
Reymann Cletus L
Bought by
Remann Cletus L and Cletus L Reymann Self Declaration Of Tr
Create a Home Valuation Report for This Property
The Home Valuation Report is an in-depth analysis detailing your home's value as well as a comparison with similar homes in the area
Home Values in the Area
Average Home Value in this Area
Purchase History
| Date | Buyer | Sale Price | Title Company |
|---|---|---|---|
| Guzowski Bruce A | $105,000 | None Available | |
| Remann Cletus L | -- | None Available |
Source: Public Records
Mortgage History
| Date | Status | Borrower | Loan Amount |
|---|---|---|---|
| Open | Guzowski Bruce A | $99,750 |
Source: Public Records
Tax History Compared to Growth
Tax History
| Year | Tax Paid | Tax Assessment Tax Assessment Total Assessment is a certain percentage of the fair market value that is determined by local assessors to be the total taxable value of land and additions on the property. | Land | Improvement |
|---|---|---|---|---|
| 2024 | $2,267 | $67,190 | $16,230 | $50,960 |
| 2023 | $2,269 | $67,190 | $16,230 | $50,960 |
| 2022 | $2,215 | $54,410 | $15,270 | $39,140 |
| 2021 | $2,231 | $54,410 | $15,270 | $39,140 |
| 2020 | $2,273 | $54,408 | $15,271 | $39,137 |
| 2019 | $2,041 | $47,265 | $13,528 | $33,737 |
| 2018 | $2,046 | $47,265 | $13,528 | $33,737 |
| 2017 | $2,030 | $47,265 | $13,528 | $33,737 |
| 2016 | $2,016 | $47,247 | $13,528 | $33,719 |
| 2015 | $1,993 | $47,247 | $13,528 | $33,719 |
| 2014 | $1,877 | $47,247 | $13,528 | $33,719 |
| 2013 | $1,947 | $47,247 | $13,528 | $33,719 |
Source: Public Records
Map
Nearby Homes