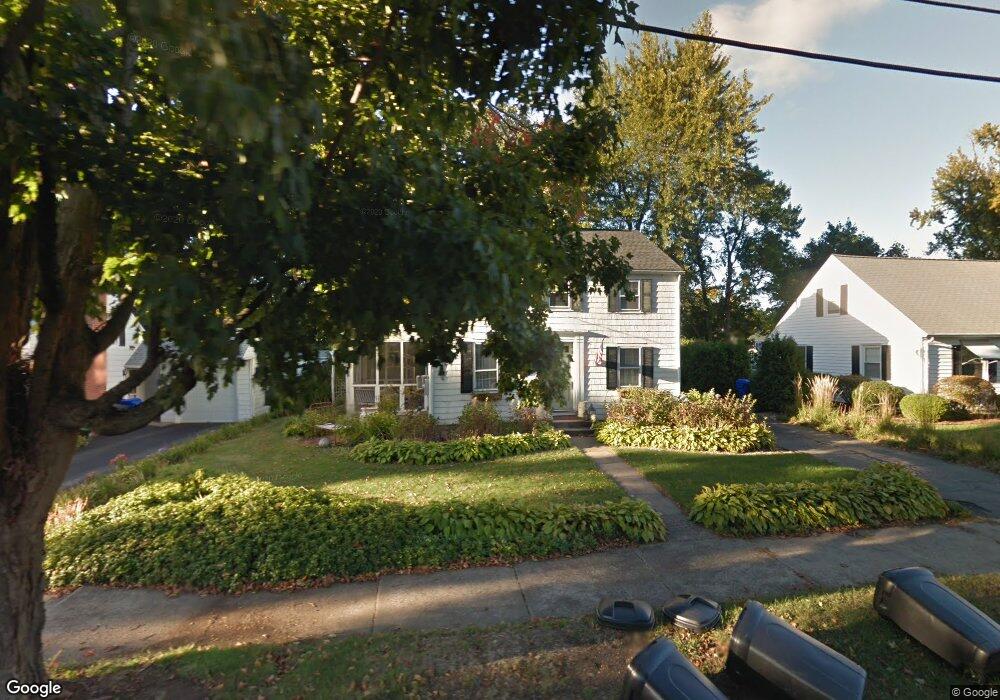
42 Weymouth St Springfield, MA 01108
Forest Park NeighborhoodEstimated Value: $277,099 - $316,000
2
Beds
2
Baths
1,244
Sq Ft
$238/Sq Ft
Est. Value
About This Home
This home is located at 42 Weymouth St, Springfield, MA 01108 and is currently estimated at $296,025, approximately $237 per square foot. 42 Weymouth St is a home located in Hampden County with nearby schools including Alice B. Beal Elementary School, Forest Park Middle School, and High School Of Commerce.
Ownership History
Date
Name
Owned For
Owner Type
Purchase Details
Closed on
Jul 23, 2007
Sold by
Napolitan Alice T and Napolitan John M
Bought by
Belanger Wendy A
Current Estimated Value
Home Financials for this Owner
Home Financials are based on the most recent Mortgage that was taken out on this home.
Original Mortgage
$145,015
Outstanding Balance
$90,828
Interest Rate
6.54%
Mortgage Type
Purchase Money Mortgage
Estimated Equity
$205,197
Purchase Details
Closed on
Mar 27, 2003
Sold by
Saville Shirley D and Lopes Shirley Saville
Bought by
Napolitan Alice T and Napolitan John M
Home Financials for this Owner
Home Financials are based on the most recent Mortgage that was taken out on this home.
Original Mortgage
$139,806
Interest Rate
5.91%
Mortgage Type
Purchase Money Mortgage
Purchase Details
Closed on
Dec 1, 2000
Sold by
Leblanc Norman E and Leblanc Albert
Bought by
Saville Shirley D
Home Financials for this Owner
Home Financials are based on the most recent Mortgage that was taken out on this home.
Original Mortgage
$103,149
Interest Rate
7.76%
Mortgage Type
Purchase Money Mortgage
Create a Home Valuation Report for This Property
The Home Valuation Report is an in-depth analysis detailing your home's value as well as a comparison with similar homes in the area
Home Values in the Area
Average Home Value in this Area
Purchase History
| Date | Buyer | Sale Price | Title Company |
|---|---|---|---|
| Belanger Wendy A | $149,500 | -- | |
| Napolitan Alice T | $142,000 | -- | |
| Saville Shirley D | $104,000 | -- |
Source: Public Records
Mortgage History
| Date | Status | Borrower | Loan Amount |
|---|---|---|---|
| Open | Belanger Wendy A | $145,015 | |
| Closed | Belanger Wendy A | $4,485 | |
| Previous Owner | Napolitan Alice T | $139,806 | |
| Previous Owner | Saville Shirley D | $103,149 |
Source: Public Records
Tax History Compared to Growth
Tax History
| Year | Tax Paid | Tax Assessment Tax Assessment Total Assessment is a certain percentage of the fair market value that is determined by local assessors to be the total taxable value of land and additions on the property. | Land | Improvement |
|---|---|---|---|---|
| 2025 | $3,539 | $225,700 | $47,000 | $178,700 |
| 2024 | $3,493 | $217,500 | $47,000 | $170,500 |
| 2023 | $3,354 | $196,700 | $39,800 | $156,900 |
| 2022 | $3,280 | $174,300 | $39,800 | $134,500 |
| 2021 | $3,107 | $164,400 | $36,200 | $128,200 |
| 2020 | $3,123 | $159,900 | $36,200 | $123,700 |
| 2019 | $2,921 | $148,400 | $36,200 | $112,200 |
| 2018 | $2,921 | $148,400 | $36,200 | $112,200 |
| 2017 | $2,743 | $139,500 | $36,200 | $103,300 |
| 2016 | $2,853 | $145,100 | $36,200 | $108,900 |
| 2015 | $2,732 | $138,900 | $36,200 | $102,700 |
Source: Public Records
Map
Nearby Homes
- 36 Weymouth St
- 48 Weymouth St
- 41 Bennington St
- 49 Bennington St
- 54 Weymouth St
- 35 Bennington St
- 26 Weymouth St
- 39 Weymouth St
- 55 Bennington St
- 45 Weymouth St
- 33 Weymouth St
- 27 Bennington St
- 55 Cooper St
- 27 Weymouth St
- 20 Weymouth St
- 21 Bennington St
- 21 Weymouth St
- 40 Cooper St
- 40 Bennington St
- 46 Bennington St