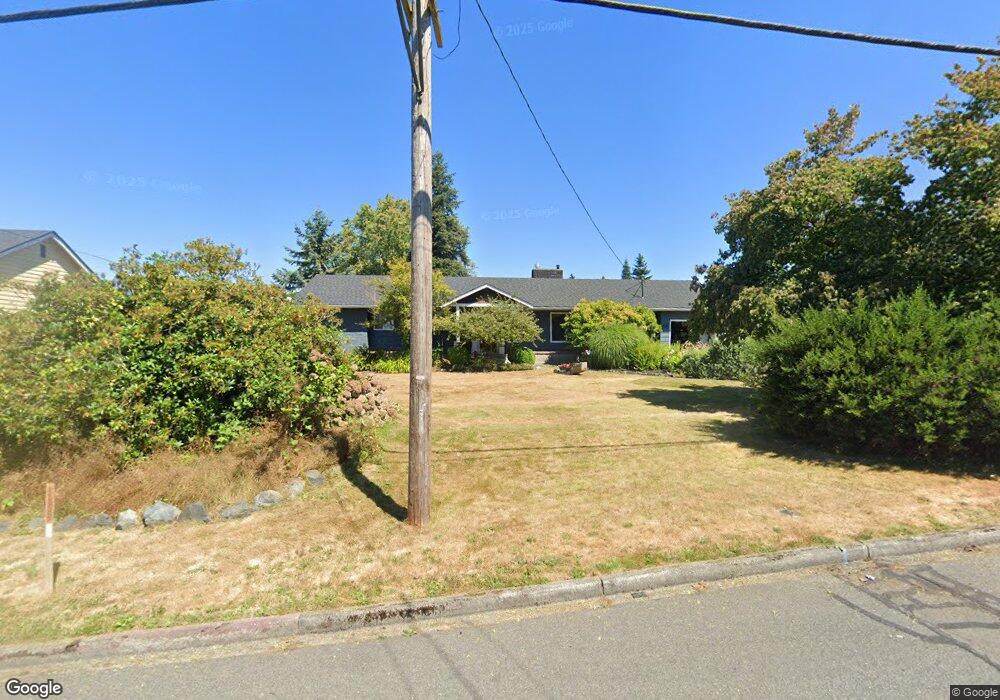
420 13th St Snohomish, WA 98290
Estimated Value: $683,000 - $804,000
4
Beds
2
Baths
1,710
Sq Ft
$440/Sq Ft
Est. Value
About This Home
This home is located at 420 13th St, Snohomish, WA 98290 and is currently estimated at $752,419, approximately $440 per square foot. 420 13th St is a home located in Snohomish County with nearby schools including Central Emerson Elementary School, Centennial Middle School, and Snohomish High School.
Ownership History
Date
Name
Owned For
Owner Type
Purchase Details
Closed on
Sep 9, 2020
Sold by
Fudge Holly E and Fudge Donald
Bought by
Fudge Evan and Fudge Caroline
Current Estimated Value
Purchase Details
Closed on
Sep 1, 2017
Sold by
Bennett Bradley J
Bought by
Fudge Donald and Fudge Holly
Home Financials for this Owner
Home Financials are based on the most recent Mortgage that was taken out on this home.
Original Mortgage
$299,000
Outstanding Balance
$249,686
Interest Rate
3.9%
Mortgage Type
New Conventional
Estimated Equity
$502,733
Purchase Details
Closed on
Feb 26, 2014
Sold by
Bennett Karie L
Bought by
Bennett Bradley J
Purchase Details
Closed on
Jan 5, 2004
Sold by
Stringer Vern and Stringer Maxine
Bought by
Bennett Bradley J and Bennett Karie L
Home Financials for this Owner
Home Financials are based on the most recent Mortgage that was taken out on this home.
Original Mortgage
$177,600
Interest Rate
5.88%
Mortgage Type
Purchase Money Mortgage
Create a Home Valuation Report for This Property
The Home Valuation Report is an in-depth analysis detailing your home's value as well as a comparison with similar homes in the area
Home Values in the Area
Average Home Value in this Area
Purchase History
| Date | Buyer | Sale Price | Title Company |
|---|---|---|---|
| Fudge Evan | -- | None Available | |
| Fudge Donald | $499,000 | Cw Title & Escrow | |
| Bennett Bradley J | -- | None Available | |
| Bennett Bradley J | $222,000 | Chicago Title Insurance Co |
Source: Public Records
Mortgage History
| Date | Status | Borrower | Loan Amount |
|---|---|---|---|
| Open | Fudge Donald | $299,000 | |
| Previous Owner | Bennett Bradley J | $177,600 |
Source: Public Records
Tax History Compared to Growth
Tax History
| Year | Tax Paid | Tax Assessment Tax Assessment Total Assessment is a certain percentage of the fair market value that is determined by local assessors to be the total taxable value of land and additions on the property. | Land | Improvement |
|---|---|---|---|---|
| 2025 | $6,514 | $717,300 | $456,000 | $261,300 |
| 2024 | $6,514 | $669,700 | $418,000 | $251,700 |
| 2023 | $6,631 | $755,900 | $451,200 | $304,700 |
| 2022 | $5,850 | $541,900 | $285,000 | $256,900 |
| 2020 | $5,539 | $476,900 | $249,100 | $227,800 |
| 2019 | $5,160 | $453,400 | $230,300 | $223,100 |
| 2018 | $5,400 | $397,300 | $197,400 | $199,900 |
| 2017 | $4,847 | $363,500 | $179,500 | $184,000 |
| 2016 | $4,899 | $356,100 | $179,500 | $176,600 |
| 2015 | $4,603 | $320,400 | $147,600 | $172,800 |
| 2013 | $3,457 | $233,600 | $85,500 | $148,100 |
Source: Public Records
Map
Nearby Homes
- 1305 Lake View Ave
- 1310 Maple Ave
- 918 Cleveland Ave
- 912 Harrison Ave
- 931 Mill Ave
- 1720 Moran Ave Unit 4
- 1721 Moran Ave Unit 31
- 830 Mill Ave
- 1713 Noble Ave Unit 76
- 800 Baird Ave
- 910 Mill Ave
- 1022 Avenue B
- 102 Stone Ridge Dr
- 1101 10th St Unit 31
- 400 6th St
- 527 Cypress Ave
- 1200 Bonneville Ave
- 521 Cypress Ave
- 612 5th St
- 401 Pine Ave
- 500 13th St
- 408 13th St
- 1312 14th Place
- 1312 Pulliam Place
- 516 13th St
- 1314 Pulliam Place
- 1230 Pine Ave
- 1302 Pine Ave
- 1315 14th Place
- 1316 14th Place
- 527 Pulliam Place
- 1322 Pulliam Place
- 1306 Pine Ave
- 1226 Pine Ave
- 1320 Pine Ave
- 529 Pulliam Place
- 1321 14th Place
- 1334 Pulliam Place
- 1320 14th Place
- 526 Pulliam Place