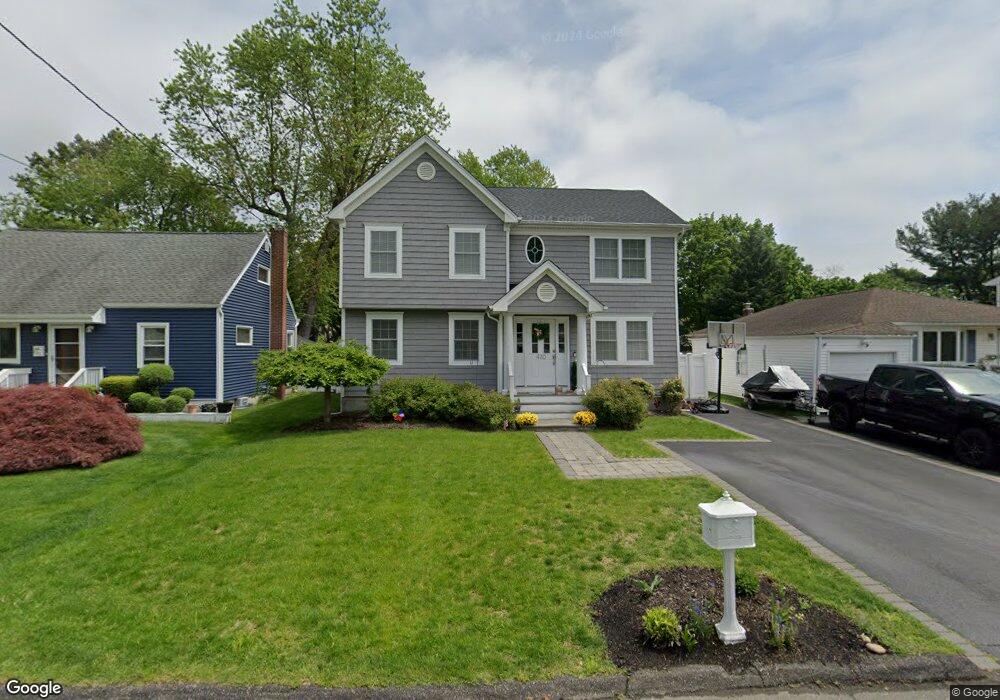
420 2nd St East Northport, NY 11731
Estimated Value: $710,000 - $825,000
4
Beds
3
Baths
2,000
Sq Ft
$393/Sq Ft
Est. Value
About This Home
This home is located at 420 2nd St, East Northport, NY 11731 and is currently estimated at $785,195, approximately $392 per square foot. 420 2nd St is a home located in Suffolk County with nearby schools including Northport Senior High School, Trinity Regional School-East Northport Campus, and The School House.
Ownership History
Date
Name
Owned For
Owner Type
Purchase Details
Closed on
Dec 14, 2015
Sold by
Marchetta Homes Inc
Bought by
Raich Yaniv
Current Estimated Value
Home Financials for this Owner
Home Financials are based on the most recent Mortgage that was taken out on this home.
Original Mortgage
$505,646
Outstanding Balance
$401,340
Interest Rate
3.98%
Mortgage Type
FHA
Estimated Equity
$383,855
Purchase Details
Closed on
Jun 1, 2015
Sold by
Crossway Electric Inc
Bought by
Marchetta Homes Inc
Purchase Details
Closed on
Jul 2, 2014
Sold by
Colombo Christine
Bought by
Crossway Electric Inc
Create a Home Valuation Report for This Property
The Home Valuation Report is an in-depth analysis detailing your home's value as well as a comparison with similar homes in the area
Home Values in the Area
Average Home Value in this Area
Purchase History
| Date | Buyer | Sale Price | Title Company |
|---|---|---|---|
| Raich Yaniv | $515,000 | None Available | |
| Marchetta Homes Inc | -- | None Available | |
| Crossway Electric Inc | $207,000 | -- |
Source: Public Records
Mortgage History
| Date | Status | Borrower | Loan Amount |
|---|---|---|---|
| Open | Raich Yaniv | $505,646 |
Source: Public Records
Tax History Compared to Growth
Tax History
| Year | Tax Paid | Tax Assessment Tax Assessment Total Assessment is a certain percentage of the fair market value that is determined by local assessors to be the total taxable value of land and additions on the property. | Land | Improvement |
|---|---|---|---|---|
| 2024 | $10,880 | $3,150 | $100 | $3,050 |
| 2023 | $5,440 | $3,500 | $100 | $3,400 |
| 2022 | $11,365 | $3,500 | $100 | $3,400 |
| 2021 | $11,034 | $3,500 | $100 | $3,400 |
| 2020 | $11,318 | $3,500 | $100 | $3,400 |
| 2019 | $22,636 | $0 | $0 | $0 |
| 2018 | $10,734 | $3,650 | $100 | $3,550 |
| 2017 | $10,734 | $3,650 | $100 | $3,550 |
| 2016 | $10,558 | $3,650 | $100 | $3,550 |
| 2015 | -- | $2,200 | $100 | $2,100 |
| 2014 | -- | $2,200 | $100 | $2,100 |
Source: Public Records
Map
Nearby Homes